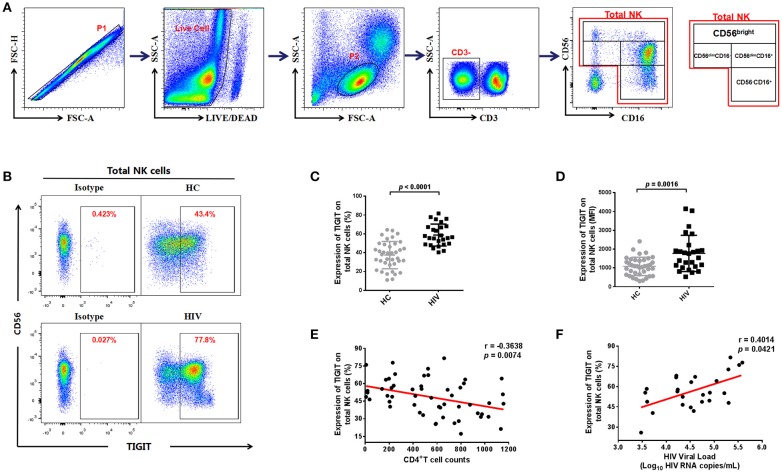
Figure 1.
The expression of TIGIT on NK cells is higher in HIV-infected individuals and correlated with HIV disease progression. (A) Gating strategy used to identify total natural killer (NK) cells and NK cell subsets. Single cells were gated using the forward scatter area (FSA) and forward scatter height (FSH), then live cells were gated by Live/Dead (BV510) staining. Lymphocytes were gated according to forward scatter/side scatter properties (FSC/SSC). Total NK cells were identified from CD3-negative lymphocytes by their expression of CD16 and/or CD56. The four NK cell subsets identified were CD3−CD56brightCD16−/+, CD3−CD56dimCD16+, CD3−CD56dimCD16−, and CD3−CD56−CD16+. All the plots were based on an HIV+ individual. (B) A representative flow cytometry plot showing the different percentages of TIGIT on NK cells in the HC and HIV groups. The expression of TIGIT was gated according to an isotype control. (C) Comparison of the percentages of TIGIT on NK cells from the HIV (n = 26) and HC (n = 38) groups. (D) Comparison of the MFI of TIGIT on NK cells from the HIV (n = 26) and HC (n = 38) groups. (E) Analysis of the correlation between TIGIT expression on NK cells and absolute CD4+ T cell counts (cells/mm3) at the same sampling time (n = 53). (F) Analysis of the correlation between the proportion of TIGIT on NK cells and plasma levels of HIV RNA (Log–10 HIV RNA copies/mL) at the same sampling time (n = 26). A Mann-Whitney U test was used for comparisons between two groups. Error bars indicate the median and interquartile range. Spearman's rank analysis was employed for evaluation of correlation. p < 0.05 was considered significant.

