Figure 2.
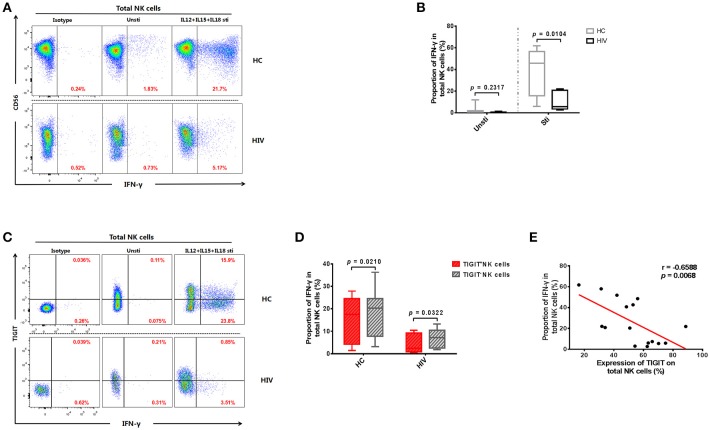
Expression of TIGIT limits the production of IFN-γ by NK cells. (A) A representative flow cytometry plot showing the different percentages of IFN-γ producing NK cells after stimulation with rIL-12 + rIL-15 + rIL-18 for 24 h in HC and HIV-infected individuals. The IFN-γ expression was gated according to an isotype control. (B) Comparison of the function of NK cells from HIV-infected (n = 8) and HC (n = 8) groups, based on their IFN-γ production on stimulation with rIL-12 + rIL-15 + rIL-18. (C) A representative flow cytometry plot showing the different percentages of IFN-γ producing TIGIT+ and TIGIT− NK cells from HIV-infected individuals after stimulation with rIL-12 + rIL-15 + rIL-18 for 24 h. (D) Paired comparisons of IFN-γ producing TIGIT+ and TIGIT− NK cells from HIV-infected individuals after stimulation with rIL-12 + rIL-15 + rIL-18 for 24 h (HIV: n = 11; HC: n = 12). (E) Analysis of the correlation between the percentage of TIGIT+ NK cells and the percentages of IFN-γ producing NK cells from HIV-infected individuals (n = 16). Mann-Whitney U tests were used for comparisons between two groups. The Wilcoxon matched-pairs signed-rank test was used for paired-group comparisons. The Spearman's rank test was employed for correlation analyses. p < 0.05 was considered significant.

