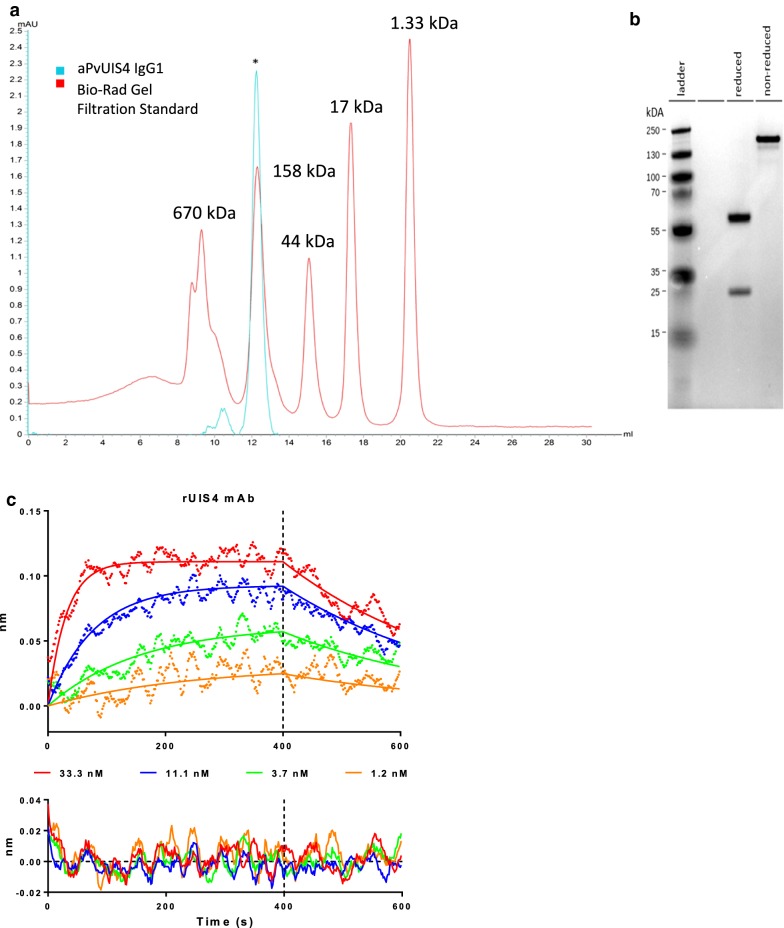
Fig. 1.
Quality control of α-rUIS4 mAb. a SEC (Superdex Increase 200 10/300 GL) trace of α-rUIS4 IgG1 (blue) and Bio-Rad Gel Filtration Standards (Red). Y-axis, absorbance (280 nm), X-axis, elution volume (mL). The asterisk indicates the antibody peak. b 4–12% Bis–Tris SDS-PAGE analysis of α-rUIS4 IgG1 under reduced (left) or non-reduced (right) conditions. c Biolayer interferometry analysis of rUIS4 mAb binding to the immunogen corresponding to the cytoplasmic sequence of P. vivax UIS4 in the concentration range of 33–1 nM. The top panel shows biphasic fits of the binding curves while the bottom panel shows the residuals of the fits

