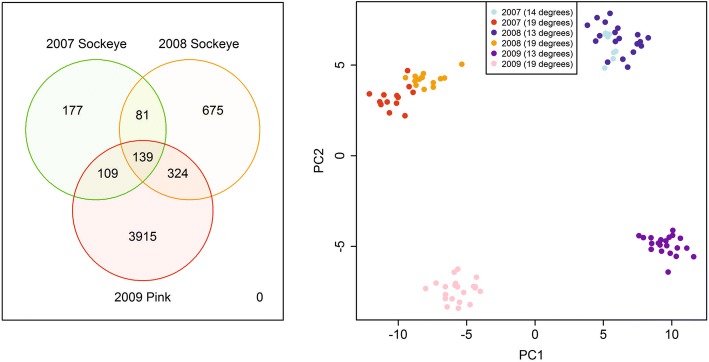
Fig. 1.
The Venn diagram on the left compares three signatures that were returned by robust limma analysis with an FDR threshold of 0.01 for the 2007 sockeye, 2008 sockeye and 2009 pink salmon data sets (corresponding to signatures DS0101, DS0102 and DS0103 in Table 6). The right plot shows PCA results for 98 samples and 139 EST identifiers returned as significant by all three robust limma analyses

