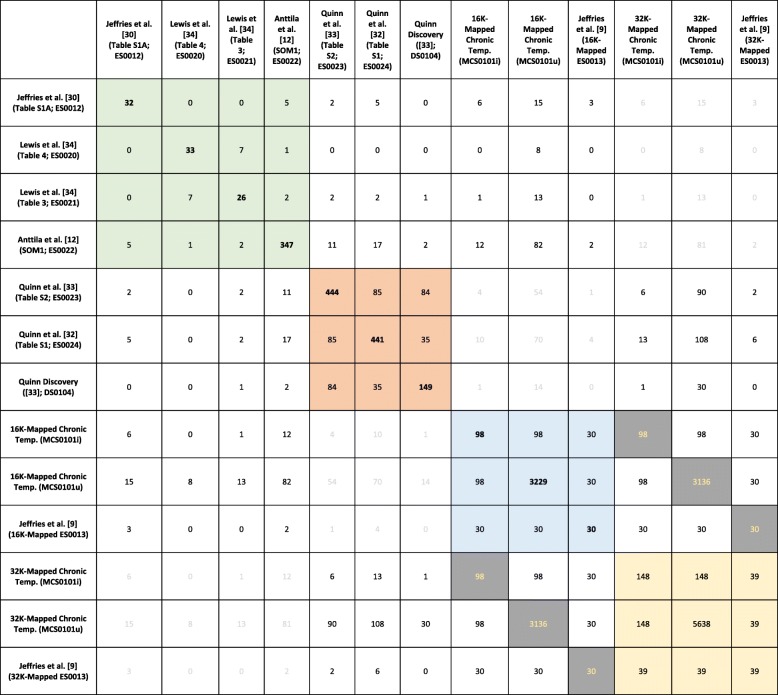
Table 1.
The overlap of features between different temperature stress response signatures. Cells colored in orange (Quinn et al. [32, 33] related signatures) indicate that the corresponding signature was derived on cGRASP32K, i.e. only a subset of features could be tested for in the GRASP16K published signatures (green block). The chronic temperature stress response signatures were based on the cGRASP44K platform. 44 K-to-16 K and 44 K-to-32 K mapping tables were used to map the signatures to the GRASP16K (green) and cGRASP32K (orange) platform. Cells with numbers displayed in light grey color indicate non-optimal comparisons (e.g. 32 K with 44 K-to-16 K) while grey cells with yellow numbers show that some of the mapped 44 K–16 K features were not found by the 44 K–32 K mapping

