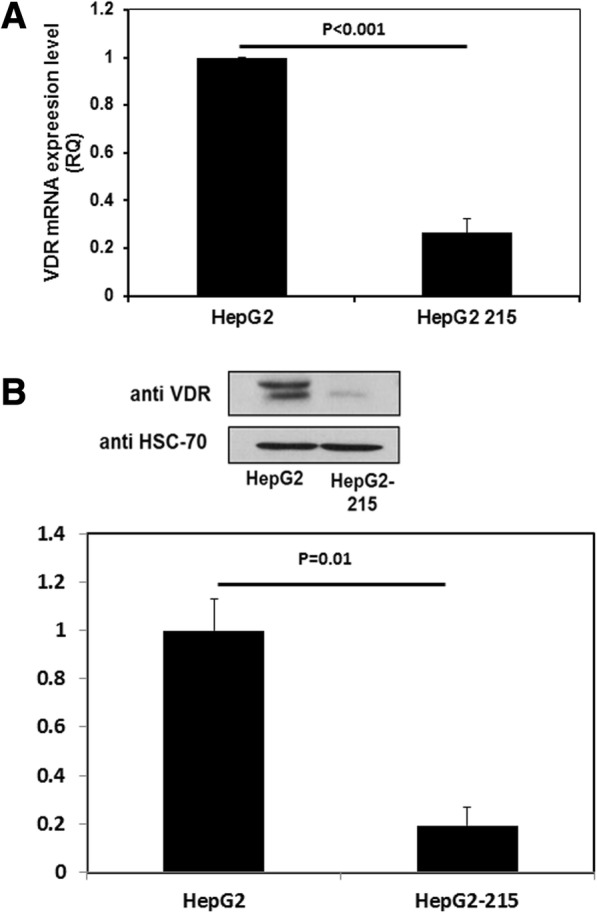
Fig. 2.

VDR transcript and protein levels were lower in HepG2–2.15 compared to HepG2 cells. HepG2.2.15 and HepG2 cells were harvested and the levels of VDR RNA (a) and protein (b) were measured using RT-PCR and western blot analysis, respectively (p < 0.001). The western blot presented in the figure is a representative of three different experiments; all of these experiments were calculated in the quantification. Results are expressed as mean ± standard deviation
