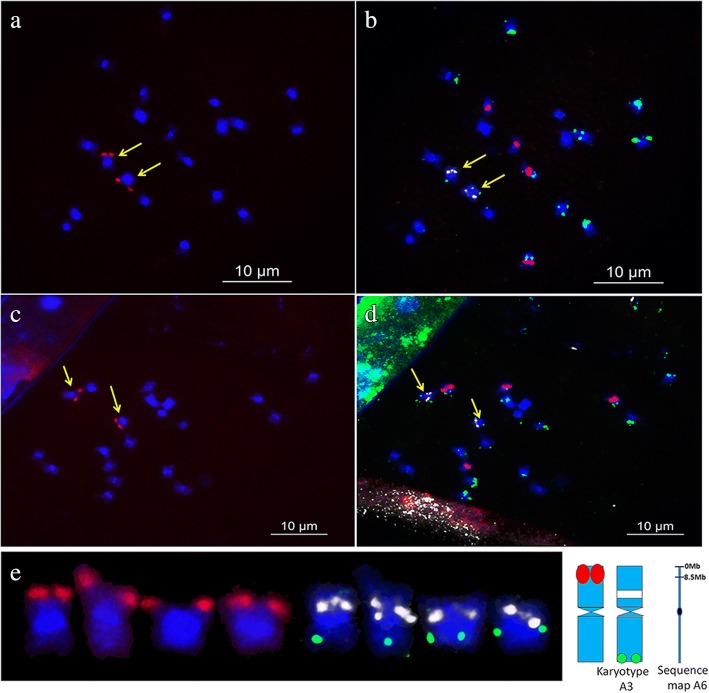
Fig. 6.
Oligopainting using single-copy oligonucleotide library 6A-1 combined with sequential FISH using DP-5, and plasmid clones 45S rDNA and 5S rDNA as probes in A. duranensis. Blue color represents chromosomes counterstained with DAPI; a and c shows oligopainting using single-copy SSON library 6A-1 (green); b and d, sequential FISH using repetitive SSON DP-5 (green), 45S rDNA (red), and 5S rDNA (white inverted from the original green); c From left to right: chromosome with signals of library 6A-1 (green); karyotype of A3, probe signals are same as (b) and (d); idiograms of the chromosome displaying signals from library 6A-1 and the karyotype of A3; and sequence map of A6 showing 0–8.5 Mb regions corresponding to library 6A-1. Yellow arrows in panels (a–d) indicate chromosomes with signals from library 6A-1

