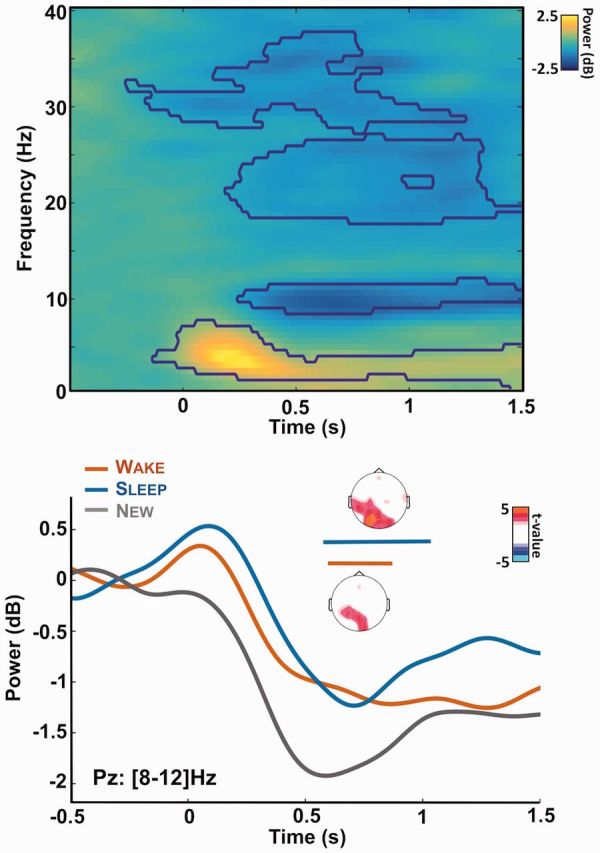
Figure 5.

Alpha desynchronization during memory recognition. Top: time-frequency decomposition of the EEG signal recorded at electrode Pz and for all trials. Power is expressed as a log ratio of the baseline activity and was averaged across participants (N = 17). The contours show the significant clusters (pcluster < 0.05). After stimuli onset, clear modulations of the power can be observed in the theta ([3–8] Hz), alpha ([8–12] Hz) and beta (>20 Hz) bands. Bottom: Power modulation for the alpha band ([8–12] Hz) over electrode Pz for the different lists of stimuli (red: wake, blue: sleep, gray: new list). Horizontal bars show the significant cluster when comparing the wake and new lists (red: pcluster = 0.02) or the sleep and new lists (blue: pcluster = 0.009) across participants. Insets show the corresponding topographies for these clusters: power was averaged on the clusters’ time-window and t-values were computed by comparing the corresponding power for the wake (or sleep) list and the new one. Nonsignificant t-values (P > 0.05, uncorrected) were set to 0.
