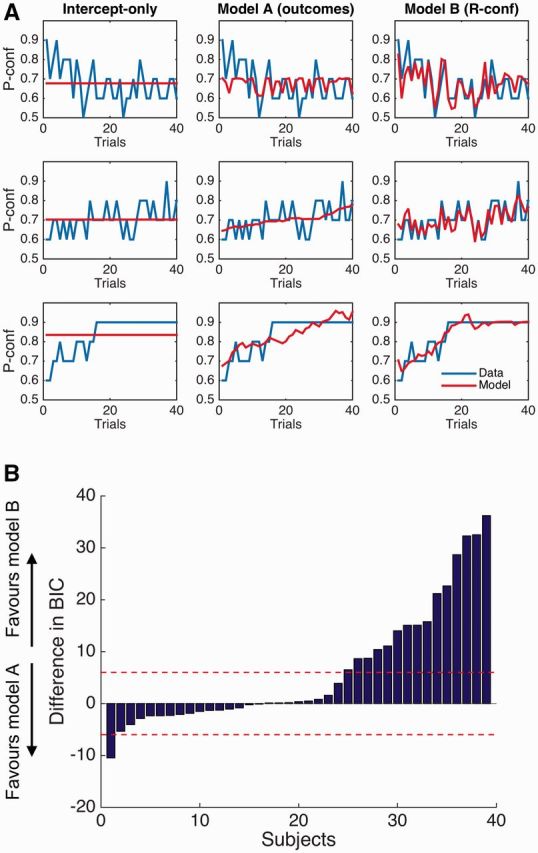
Figure 6.

Models of P-confidence updates. (A) Fits of each candidate learning model to data from three example subjects. The blue lines show subject ratings of P-confidence; the red lines show model fits. (B) Difference in BIC scores for Models A and B for each subject. A difference in BIC of 6 or more is considered strong evidence in favor of a particular model. By comparing model fits at the group level using a Bayesian random-effects model selection algorithm (Stephan et al. 2007), we found that Model B provided the best account of subjects’ data in the group as a whole (exceedance probability = 0.98).
