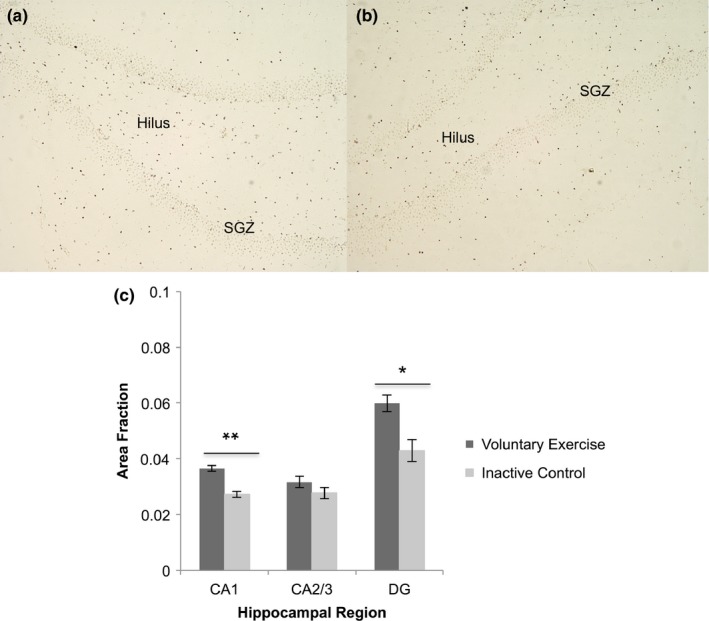
Figure 1.

Caspase‐3 expression by hippocampal region. (a) Caspase‐3 labeling (dark brown) in the dentate gyrus (DG) of a voluntary exercise animal. (b) Caspase‐3 labeling in DG of an inactive control animal. Differences between voluntary exercise and control were most apparent in the hilus and subgranular zone (SGZ) of DG. (c) The voluntary exercise group displayed a significant elevation in caspase‐3 expression in CA1 (t (8) = 4.98, **p < 0.01) and DG (t (8) = 3.81, *p < 0.05) compared to inactive controls. There was no difference between groups in CA2/3 (t (8) = 1.63, p > 0.05). Values are mean ± SEM. SGZ: subgranular zone
