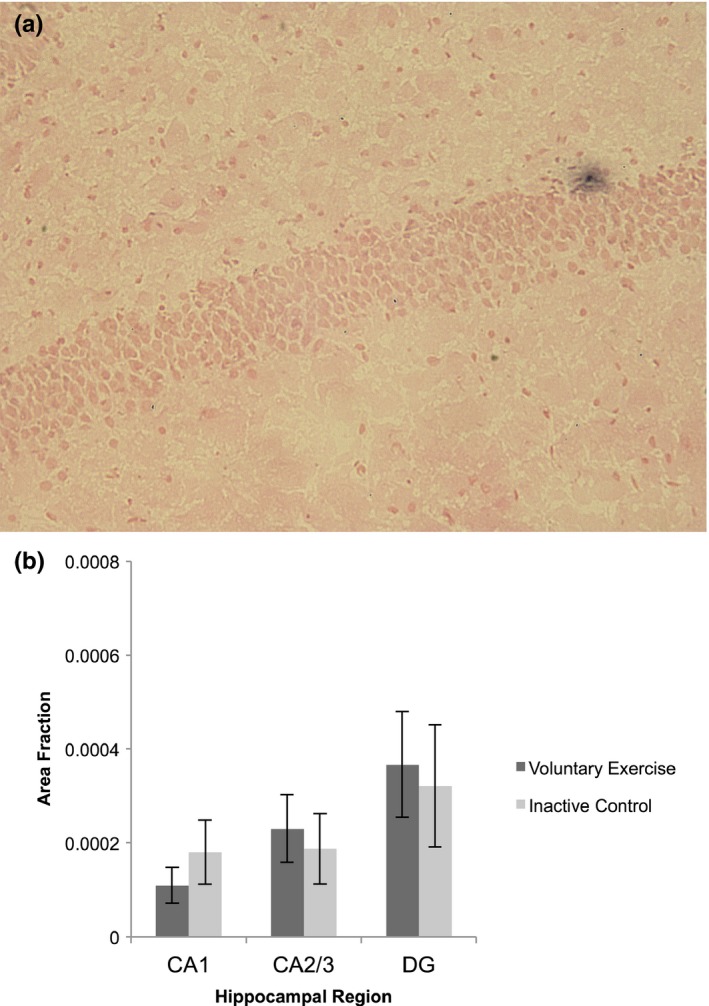
Figure 4.

TUNEL labeling for apoptotic cells in the hippocampus. (a) Example of a TUNEL positive cell (black) in the hippocampal dentate gyrus. (b) There were no significant differences in TUNEL labeling in any region of the hippocampus (CA1: t (18) = 0.90, p > 0.05; CA2/3: t (18) = 0.41, p > 0.05; dentate gyrus/DG: t (18) = 0.26, p > 0.05) between voluntary exercise and inactive control groups. Values are mean ± SEM
