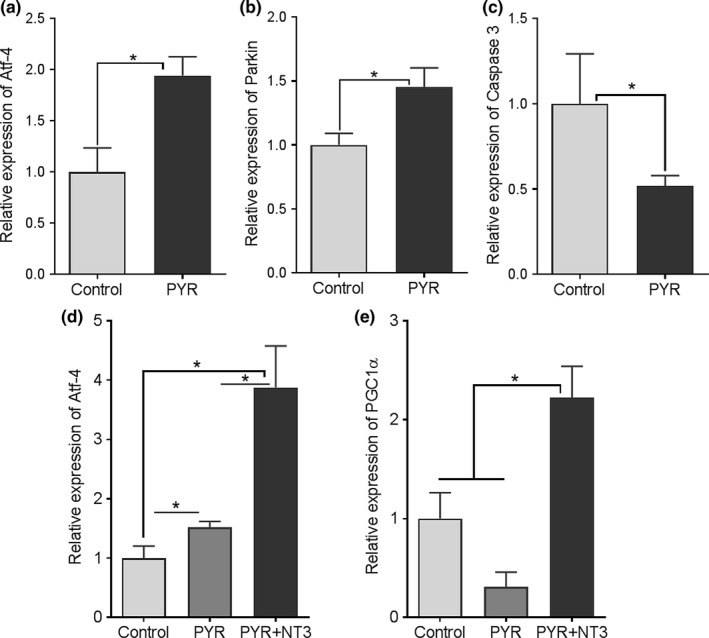
Figure 5.

Relative expression levels of Atf4 (a, d), Parkin (b), and Caspase 3 (c) and PGC1α (e) in sciatic nerve samples collected at the end point. GAPDH was used as housekeeping gene in the analyses. Results shown are mean ± SEM unless otherwise indicated; n = 4–6 each group. Statistical significance: Student’s t test (for a–c) and one‐way analysis of variance followed by Tukey's multiple comparison test (for d and e); *p < 0.05. Control stands for samples from untreated TrJmice
