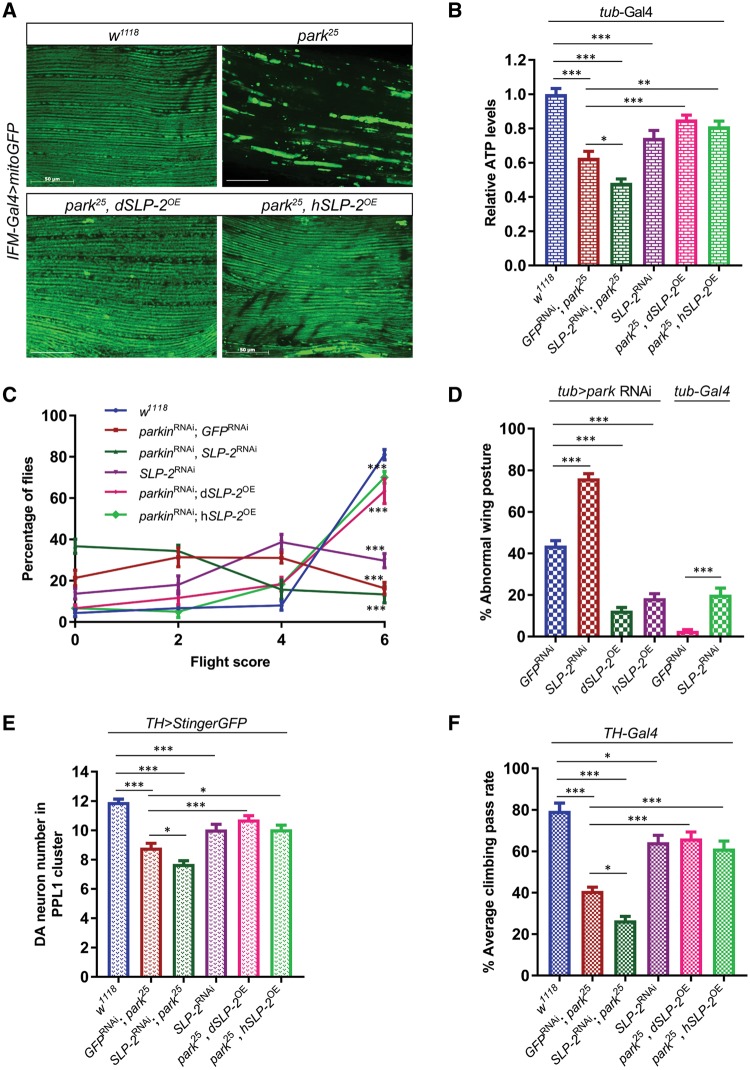
Figure 5.
SLP-2 genetically interacts with Parkin and rescues parkin mutant phenotypes when overexpressed in the Drosophila model. (A) Mitochondrial morphology visualized by mitoGFP transgene driven by IFM-Gal4 in adult indirect flight muscles of wild type (w1118) and parkin null (park25) flies alone or in combination with Drosophila SLP-2 (dSLP-2) or human SLP-2 (hSLP-2) overexpression transgenes. Indirect flight muscles from thoraces of 3-days old flies were dissected to record mitoGFP pattern. Scale bar = 50 μm. (B) Measurements of ATP levels from thoracic muscles of 5-days old flies expressing transgenes in all tissues under the control of tub-Gal4. The relative levels of ATP were determined by dividing the luminescence by the total protein concentration and normalized to wild-type flies. (C) Flight ability of wild type (w1118), parkin and SLP-2 RNAi fly lines with or without SLP-2 transgenes expressed under the control of tub-Gal4. 1-week old flies were used to perform the flight assay. A minimum of 100 flies were tested each time in two independent experiments. Flight score of 6 indicates a wild type flight function, score of 0 represents a flightless phenotype. (D) Quantification of abnormal wing posture phenotype in wild type, parkin and SLP-2 RNAi flies with or without SLP-2 transgenes. The percentage of flies displaying abnormal wing posture was determined in 2-weeks old F1 males. (E) Quantification of DA neurons in PPL1 cluster. The numbers of DA neurons in the PPL1 cluster visualized by TH > StingerGFP on the posterior side of the brain were counted. (F) Measurement of motor function using climbing assay. 4-weeks old males aged at 25 °C were subjected to climb an 8 cm mark, and the percentage of flies that crossed this mark in 10sec was determined. A minimum of 100 flies were tested in repeated trails as described in the methods section. Transgenes were expressed under the control of TH-Gal4. Statistical differences were calculated by one-way ANOVA followed by Tukey’s post hoc test to correct for multiple comparisons. Data is plotted as ± SEM. ***P ≤ 0.001, **P ≤ 0.01, *P ≤ 0.05.

