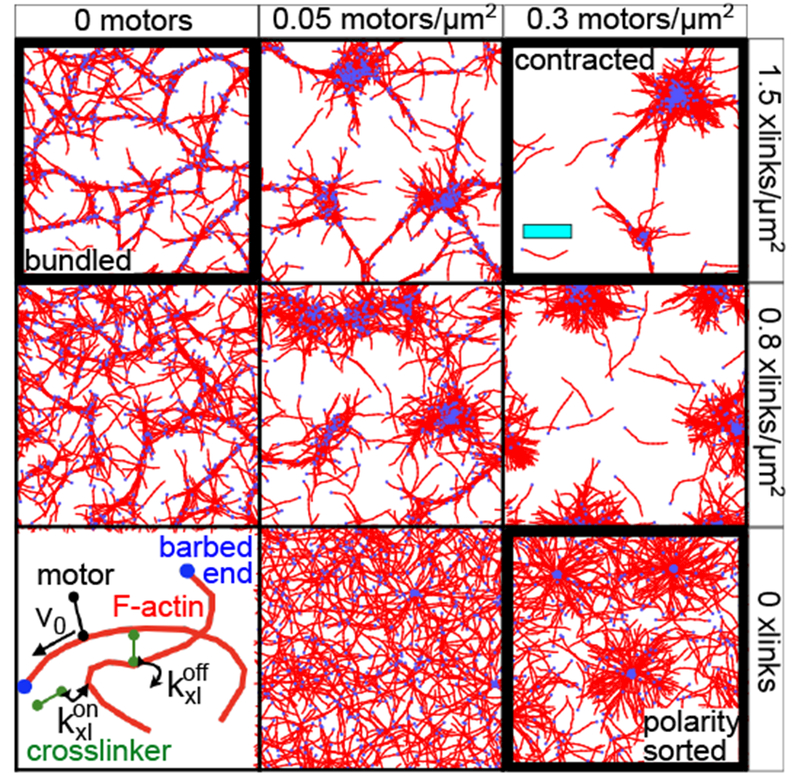
Fig. 1.

Network structures, (lower left) Schematic of the model31 with F-actin (red), crosslinkers (green), and motors (black). Bound motors walk towards F-actin barbed ends (blue), (remaining panels) Network structures at 400 s for indicated motor and crosslinker densities. These include a bundled network (upper left) formed by filaments and crosslinkers, a polarity-sorted network (lower right) formed by filaments and motors, and a contracted network (upper right) formed from filaments, crosslinkers, and motors. For clarity, only the actin filaments are shown; the motors and crosslinkers are shown in Fig. S1. Cyan scale bar represents 10 μm.
