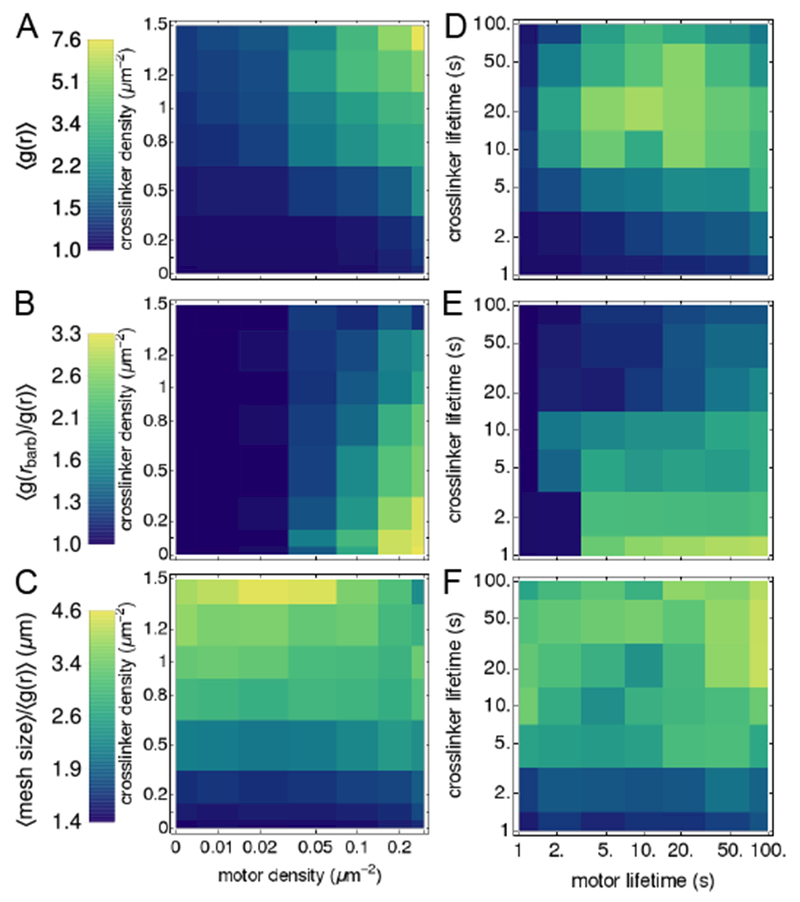
Fig. 4.

Maps of network properties. Colors indicate the values of order parameters characterizing network contractility (A,D), polarity sorting (B,E), and bundling (C,F), at constant filament length, L = 10 μm, binding affinity (left), and densities ρm = 0.2 μm−2, ρxl = 1 μm−2 (right, plotted as a function of lifetime, ; structures shown in Fig. S5). Averages are over the last 50 s of five simulations of 400 s; order parameters that are functions of distance, e.g., g(r), are integrated over 0 < r ≤ 10 μm. Error bars for representative curves are shown in Fig. S3.
