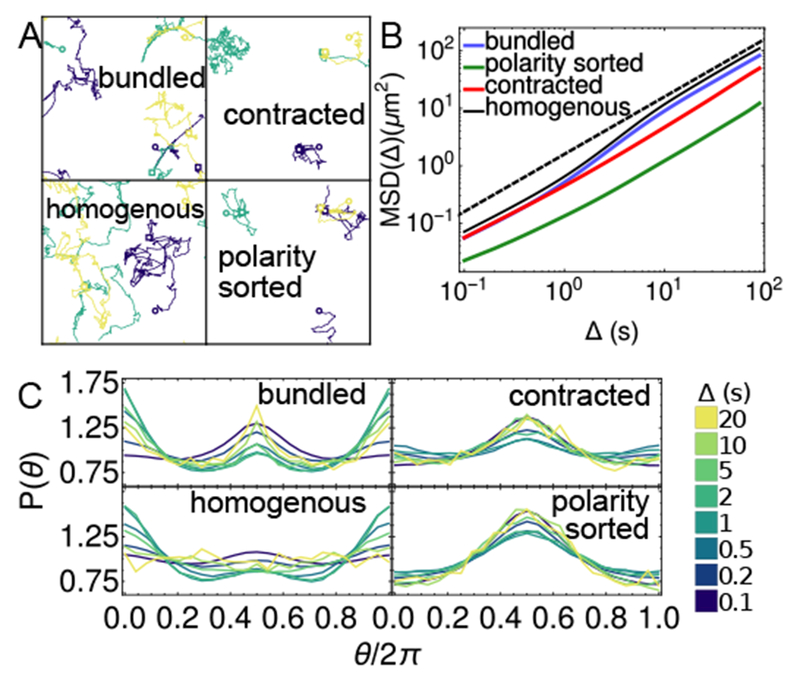
Fig. 6.

Transport properties of motors on actin structures. (A) Example trajectories of three motors (each a different color) on actin networks (filaments shown in Fig. 1 and Fig. S1). Open circles show initial position of each motor, and open squares show their final position after 500 timesteps. (B) Mean squared displacement for motors on structures. Black dashed line shows diffusive behavior, MSD(tf, Δ) ∝ Δ. (C) Distributions of angles between subsequent motor displacements for different lag times, Δ51. Averages in (B-C) are over 770 motors over the last 100 s of 5 independent trajectories of 200 s, at each condition.
