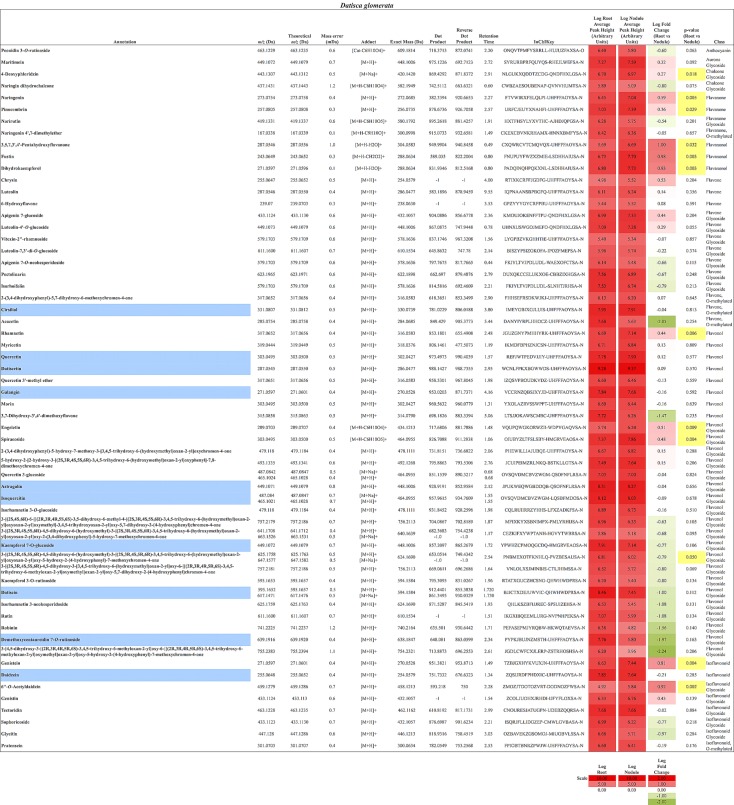
FIGURE 3.
Flavonoids identified in D. glomerata roots and nodules. All annotations conform to MSI level 2. For each flavonoid the abundance in both the roots and nodules is given as the log average peak height of 10 samples and presented as a heat-map. The names of molecules considered highly abundant are highlighted in blue. Significant changes in abundance between roots and nodules are highlighted in yellow.

