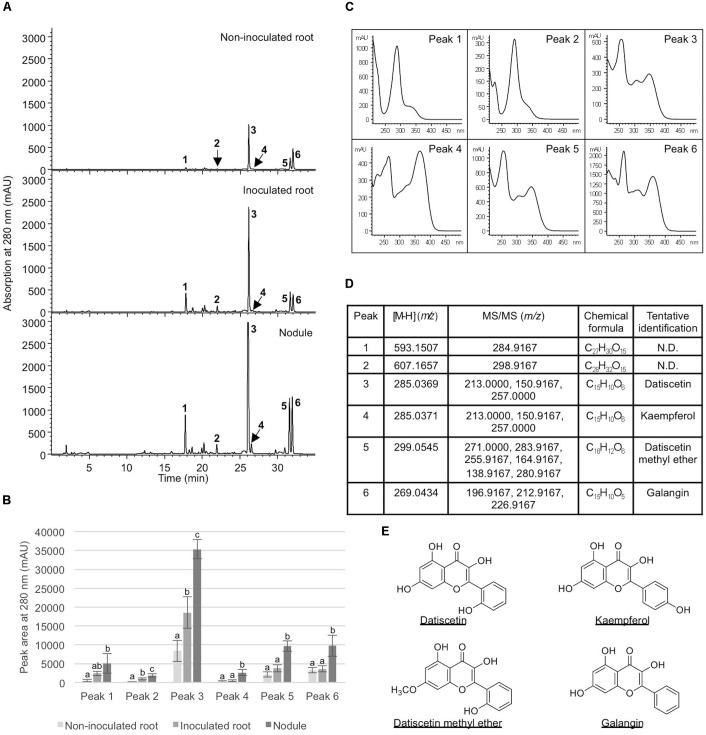
FIGURE 5.
Analysis of metabolites in Datisca glomerata roots and nodules. (A) Representative HPLC elution profiles of phenolic metabolites extracted from non-inoculated and inoculated D. glomerata roots as well as nodules. Peaks (1–6) that show differential accumulation in roots and nodules are indicated. (B) Peak areas of differentially accumulated phenolic metabolites. Data shown are the average of four biological replicates ± standard deviation. Different letters indicate significant (P < 0.05) differences in metabolite levels among non-inoculated root, inoculated root, and nodule for each peak. (C) Absorption spectra of peaks 1–6. (D) MS and MS/MS analyses of peaks 1–6. (E) Chemical structures of tentatively identified phenolic metabolites in D. glomerata roots and nodules.

