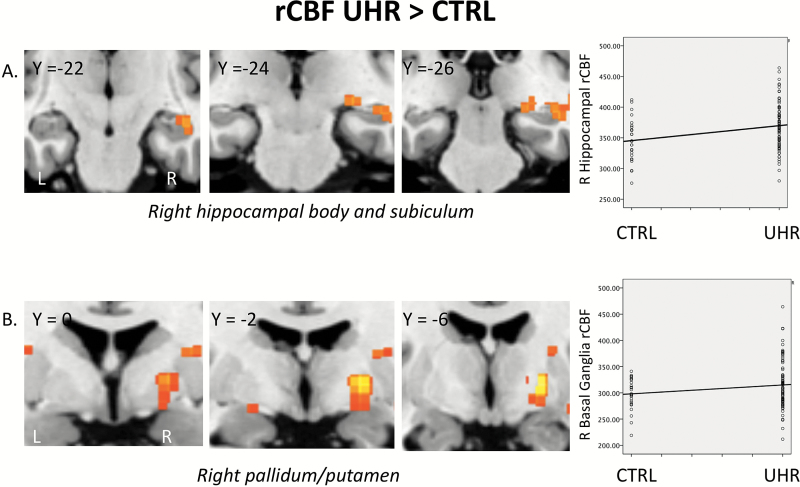
Fig. 1.
(A) Coronal sections through the medial temporal lobe showing elevated resting cerebral blood flow (rCBF) in UHR relative to CTRL subjects (PFWE = .021) and scatter plot showing rCBF levels in each case. (B) Coronal sections through basal ganglia regions showing elevated rCBF in UHR relative to CTRL subjects (PFWE = .03) and scatter plot showing rCBF levels in each case. rCBF levels are quantified in (ml/100g/sec) × 10.

