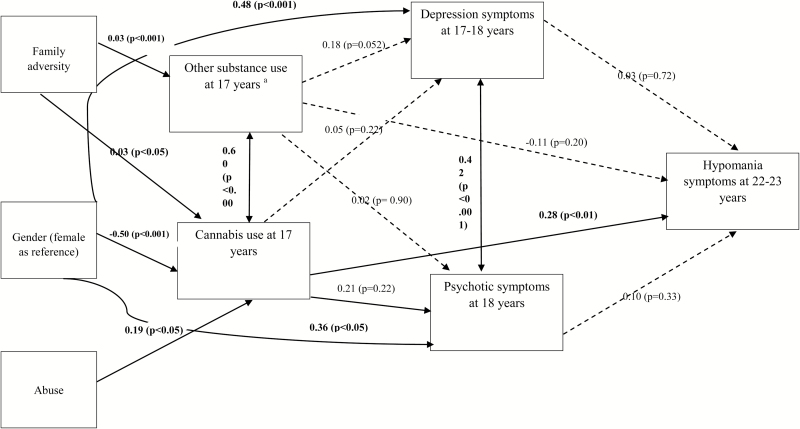
Fig. 1.
Pathways from cannabis use to hypomania. Main direct effects in the final path model. Significant pathways signified by solid arrows; nonsignificant modeled pathways represented by dotted lines; Model fit: CFI = 1.00; RMSEA = 0.00; chi-square model fit = 2.57, P = .92; aOther substance use = alcohol and control drugs.

