Fig. 2.
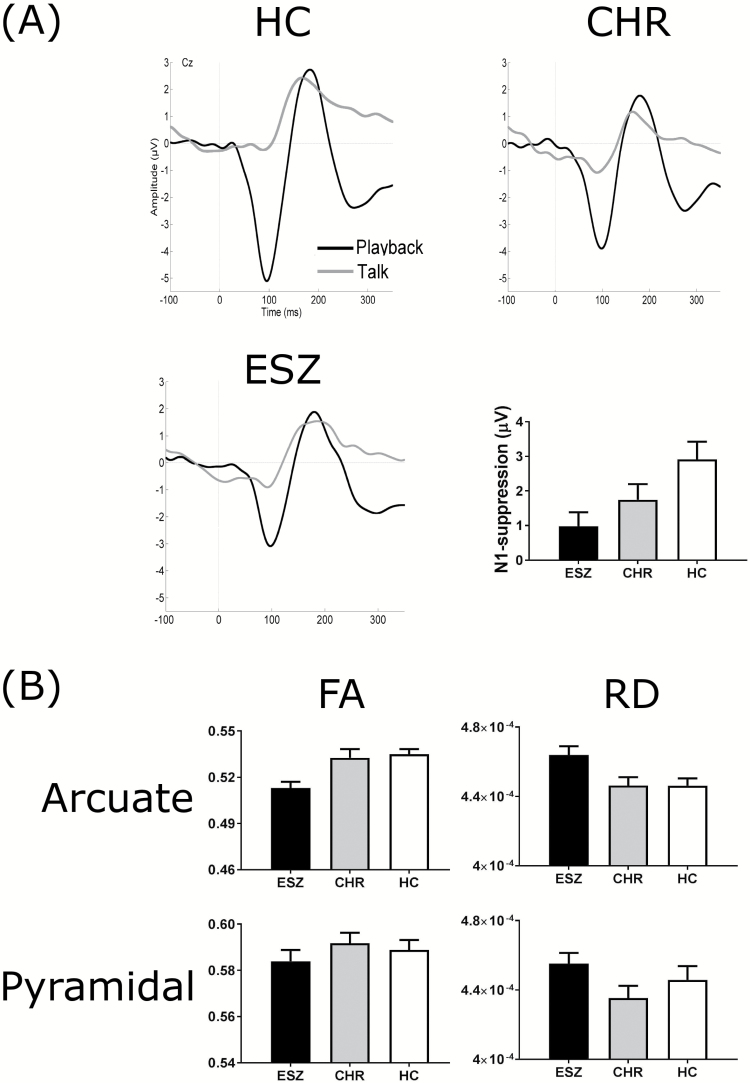
(A) Auditory-evoked potential waveforms for the Talk–Play data for the 3 participant groups. The grand average waveforms for the Talk condition and Playback condition are shown for the healthy control (HC, n = 59), clinical high-risk (CHR; n = 40) and early illness schizophrenia (ESZ; n = 51) participants. The recording electrode was Cz. Bar graphs illustrating the between-group differences in mean N1-suppression are shown at the bottom right of A. N1-suppression was calculated as the N1-amplitude in the Playback condition subtracted from the N1-amplitude in the Talk condition. Error bars represent the standard error of the mean. (B) Between-group comparisons of the structural integrity of the arcuate fasciculus and pyramidal tract. The data for the arcuate fasciculus are presented on the top row and the pyramidal tract on the bottom row. Fractional anisotropy (FA) is presented in the left column, while radial diffusivity (RD) is presented in the right column. The ESZ participants are shown as black bars, the CHR participants as gray bars, and the HC participants as white bars. Error bars represent the standard error of the mean.

