
Figure 1.
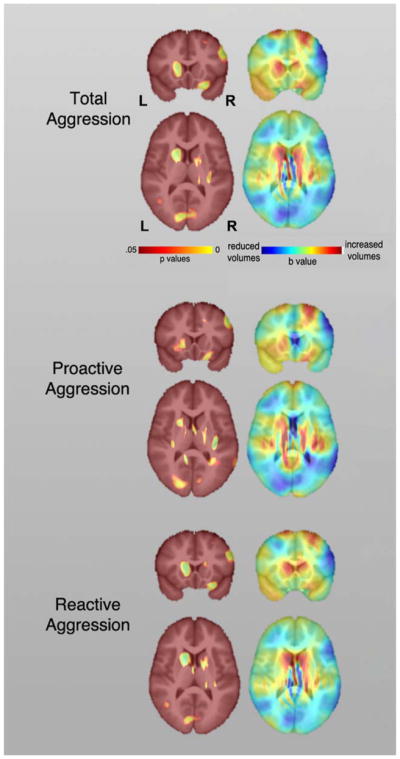
Probability maps showing significant correlations between brain tissue volumes and total (top), proactive (middle) and reactive aggression (bottom) across the sample. The corresponding beta maps indicates the direction of the effects, with cold colors indicate negative and hot colors positive correlations.