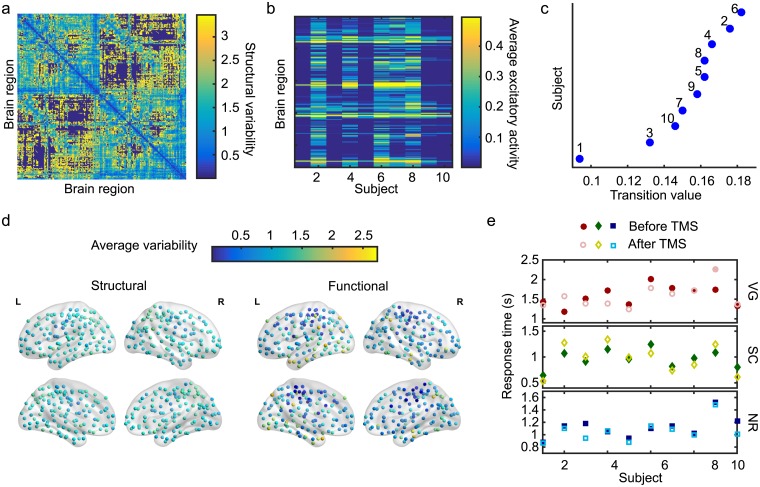
Fig 2. Assessing variability in structure, dynamics, and performance.
(a) Variability in the connection strengths between pairs of brain regions across ten subjects, measured as the standard deviation of edge weights between brain regions across individuals, normalized by the mean of edge weights. Although there are few regions of low variability (blue), there are a significant number of regions with moderate to high variability (green to yellow). (b) Spatial patterns of excitatory activity vary across individuals due to regional variations in the structural connectivity between subjects. Each column represents the temporal average of the excitatory activity across brain regions for a given individual in the excited state and is unique in terms of the overall activity pattern. (c) The global coupling transition value () also varies across our cohort of ten individuals. (d) Spatial mapping of the average variability in structural connectivity and functional activity across individuals. (e) Cognitive task performance for the ten subjects was assessed by experimentally measuring the response times for three language-demanding tasks: verb generation (VG), sentence completion (SC), and number reading (NR), both before (filled symbols) and after (open symbols) a targeted transcranial magnetic stimulation (TMS) to the left-inferior frontal gyrus (L-IFG) of the brain.

