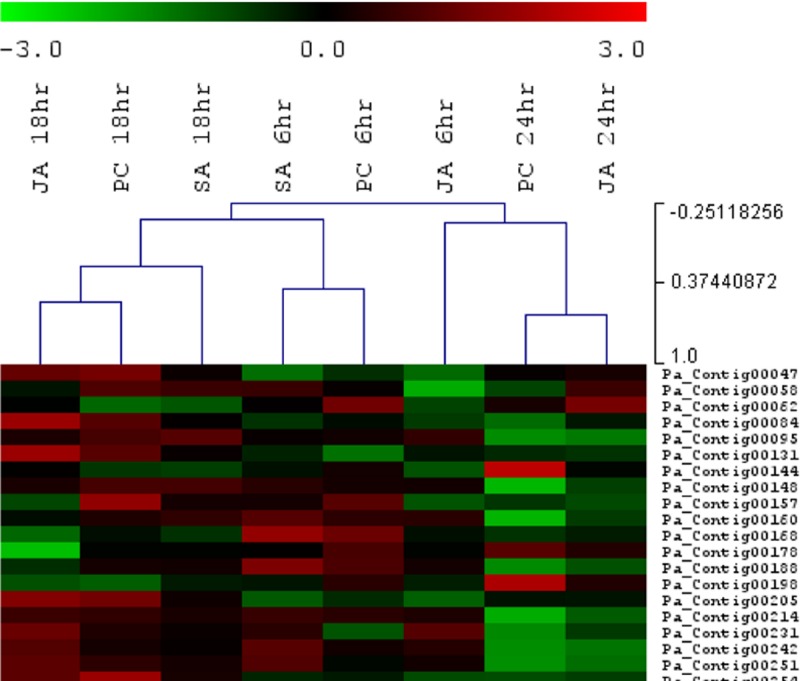
Fig 3. HCL performed on fold-change filtered avocado transcripts in the SA (salicylic acid), PC (Phytophthora cinnamomi) and JA (MeJA) datasets.

The colour-scale indicates Log2 fold-change and the branches of the trees are ordered according to the Pearson correlation coefficient (r), with nodes closer to 1 indicative of a positive correlation.
