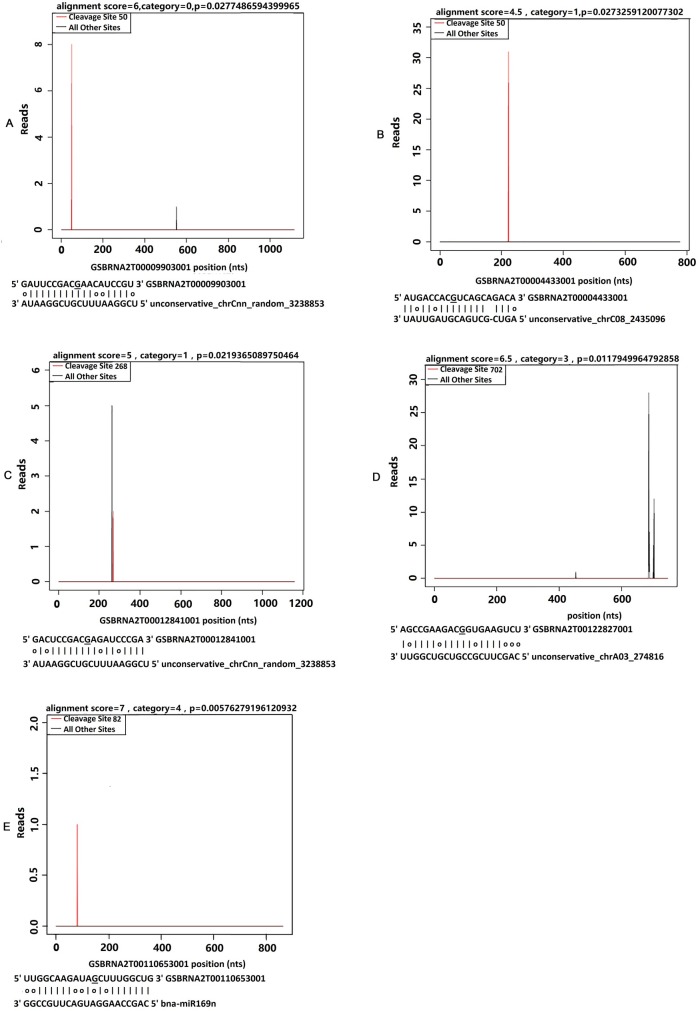
Fig 6. MiRNA targets using degradome sequencing are presented in the form of target plots (t-plots).
The normalized numbers in plotting the cleavages on target mRNAs were used to refer to as ‘target plots’ (t-plots) by German et al. [28]. Representative t-plots for category 0 (A), category 1 (B), category 2 (C), category 3 (D) and category 4 (E) are shown (Category 0–4 were based on Addo-Quaye et al. (2008), Xu et al. (2012) and Liu et al. (2014a)). The cleavage sites are shown in red, and all the other sites are in black. The underlined nucleotide on the target transcript indicates the cleavage site detected in the degradome.

