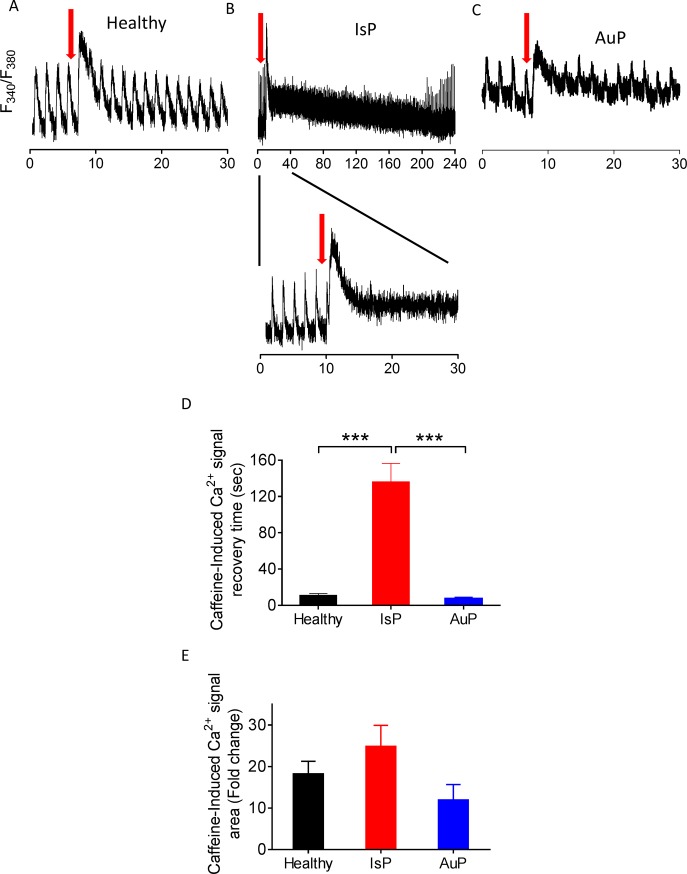
Fig 9. Effect of caffeine on [Ca2+]i cycling of healthy and mutated iPSC-CM.
Representative [Ca2+]i transients from healthy [A], IsP [B] and AuP [C] iPSC-CM under caffeine administration (indicated by red arrow). The IsP cardiomyocytes display two-phase decline in [Ca2+]i level: fast decline as in healthy cells, and gradual slow decline until reaching [Ca2+]i basal level [B]. [D] Average recovery time from maximum of caffeine peak phase until the beginning of departing phase of the first measurable [Ca2+]i transient post-caffeine insertion of healthy (24.5 clone n = 11), IsP (clone 23.2 n = 2, clone 23.10 n = 4, n = 6) and AuP (n = 8) iPSC-CM. [E] display the percent change in fold change in area of caffeine-induced [Ca2+]i signal compared to the pre-caffeine [Ca2+]i transient of healthy (clone 24.5 n = 11), IsP (clone 23.2 n = 2, clone 23.10 n = 4, n = 6) and AuP (n = 8) iPSC-CM. One-way ANOVA was performed followed by Holm-Sidak test, ***P < 0.001 (vs Control and AuP).

