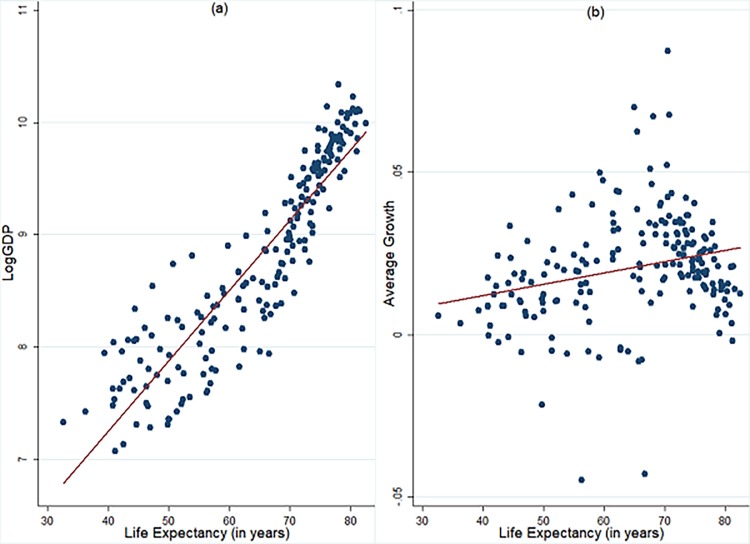
Fig 3. Relationship between average life expectancy and per capita income, growth.
a) Scatter plot between LogGDP and Life Expectancy b) Scatter plot between Growth and Life Expectancy. LogGDP is the natural logarithm of real per capita income (at PPP prices). Growth: Growth rate of real per capita income calculated as difference of natural logarithm of real per capita income. Life Expectancy: Life Expectancy at Birth (in years). The data presented here is ten-year averaged.

