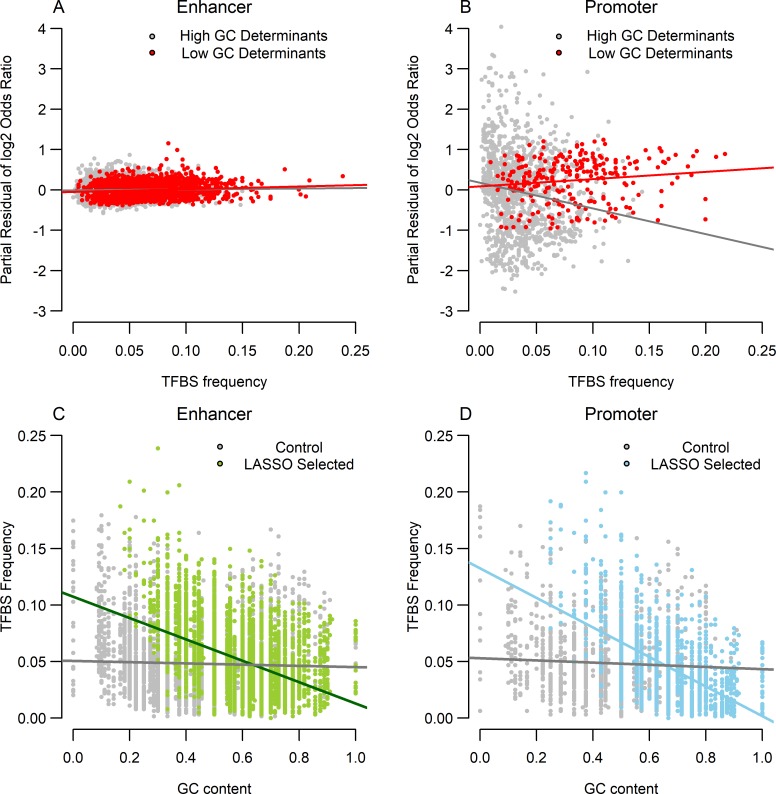
Fig 4. Relationships between several biological variables using LASSO selected sequence determinants from human.
First, we present the results from our linear model in Table 3 ((A): Enhancer model results, (B): Promoter model results). To demonstrate the relationship between log2OR and TFBS frequency, we regressed out GC content on log2OR and drew scatterplots between the resulting partial residual of log2OR and TFBS frequency. We further separated the points into two groups, above and below 0.5 GC content. As seen in Fig 4(A) and 4(B), a clear interaction effect was detected only in the promoter model, and TFBS frequency for low GC content is positively correlated with log2OR in both models, although the positive correlation is clearer in the promoter model (R2: 0.012 and 0.021, P-value: 2.7×10⁻⁵ and 0.026, for enhancer and promoter, respectively). In Figs 4(C) and 4(D), the negative relationships between GC content and TFBS frequency in enhancers and promoters are depicted in comparison to the background. The green and blue points are results from LASSO selected sequence determinants, while the gray points are control data sets consisting of randomly selected sequence fragments that are not sequence determinants.

