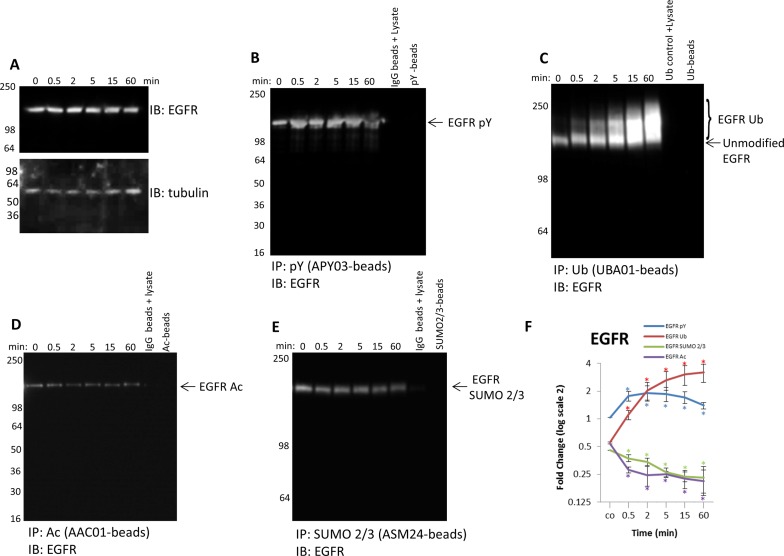
Figure 5. Detect endogenous, dynamic changes of the four PTMs for EGFR.
(A) Serum-restricted A431 cells were stimulated with EGF for the given time period. Whole cell lysate (WCL) was analyzed for EGFR levels. Tubulin was used as a loading control. Unstimulated and EGF-treated A431 lysates were incubated with (B) APY03-beads or IgG control beads to immunoprecipitate tyrosine-phosphorylated proteins and analyzed for tyrosine phosphorylated EGFR, (C) UBA01-beads or CUB02 control beads to capture ubiquitinated proteins and analyzed for ubiquitinated EGFR, (D) acetyl lysine binding beads or IgG control beads to immunoprecipitate acetylated proteins and analyzed for acetylated EGFR, (E) and ASM24-beads or IgG control beads to immunoprecipitate SUMOylated 2/3 proteins and analyzed for SUMOylated 2/3 EGFR. Shown are representative Western blots from n≥3 independent experiments. (F) Quantitation of densitometric analysis of EGFR PTMs. Error bars represent S.E.M. t test statistical analysis was performed. *P<0.05.

