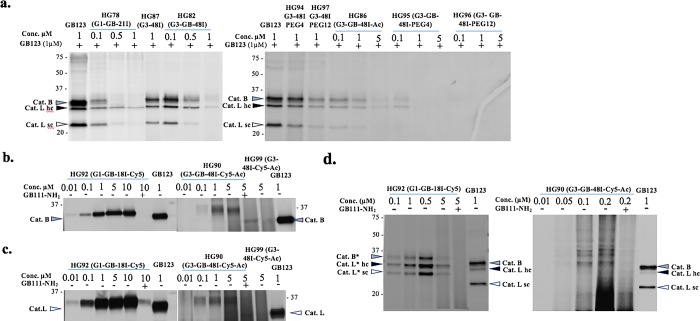
Figure 2.
Cathepsin binding of IN-ABPs assessed by competition assay and direct labeling. (a) Inhibition of endogenous cathepsin activity within intact NIH-3T3 cells, as described in Experimental Section. Decrease in band intensity indicates efficient cathepsin binding. (b,c) Direct labeling of recombinant cathepsin B and L by G1 and G3 Cy5 labeled IN-ABPs (HG92 and HG90). Indicated concentration of probes were incubated with enzymes with or without cathepsin inhibitor (GB111-NH2)36 pretreatment. Samples were run on gel that was scanned for fluorescence. Increase in band intensity indicates efficient cathepsin binding. (d) Intact NIH-3T3 cells with or without inhibitor pretreatment were treated with HG92, HG90 for 24 h in growth media, cells were lysed and separated by gel that was scanned for fluorescence. Clear selective binding of endogenous cathepsins are seen. Molecular weight shift of cathepsin-probe complex is marked with *.

