Figure 3.
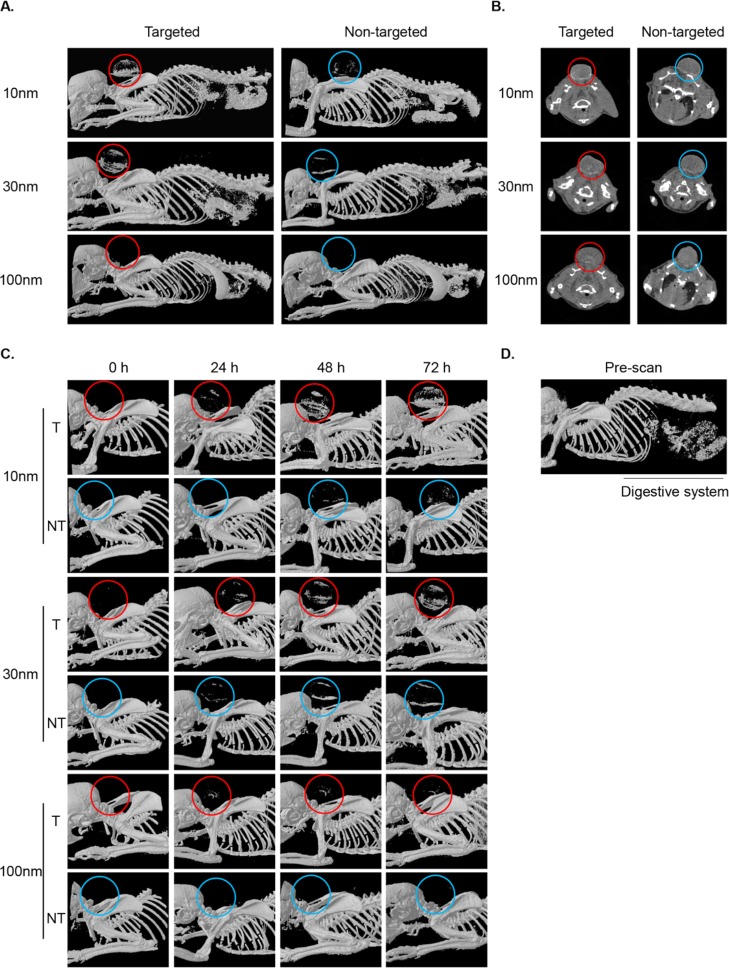
Non-invasive micro-CT imaging of tumor bearing mice. (A) CT scans of mice 72 h postinjection of 10, 30, and 100 nm T or NT GNPs (5 mg of gold per mouse). Representative CT images of volume-rendered 3D images represent X-ray absorption of bones and gold, circles indicate tumor location. (B) 2D axial cross-section images of the same mice as in A. Accumulation of T-GNP-ABPs at the tumor led to significant signal enhancement (shown in red circles). The highest enhancement was obtained with 10 nm T-GNP-ABPs. (C) Time course of all T-GNP-ABP and NT-GNP compounds. Images were acquired prior to probe injection (0 h) and 24, 48, and 72 h postprobe injection. (D) Prescan image indicates that contrast from the digestive system is attributed to the high mineral content of the chow.

