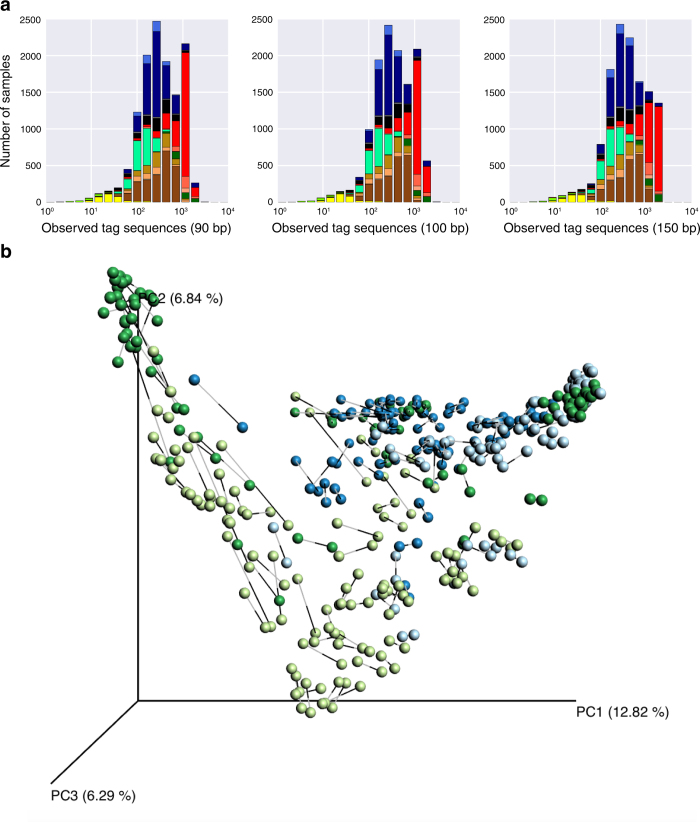
Extended Data Figure 3. Sequence length effects on observed diversity patterns.
The effect of trimming from 150 bp (the approximate starting length of some sequences) to 90 bp (the trimmed length of all sequences in this meta-analysis) was investigated by comparing alpha- and beta-diversity patterns. All samples, at each sequence length, were rarefied to 5,000 sequences per sample. a, Alpha-diversity distributions of n = 12,538 biologically independent samples displayed as histograms of observed tag sequences coloured by environment (EMPO level 3). Among these samples with sequence length ≥ 150 bp, the distributions are largely preserved when trimming from 150 to 100 to 90 bp. b, Procrustes goodness-of-fit between the 90-bp (grey lines) and 150-bp (black lines) Deblur principal coordinates (unweighted UniFrac distance) for n = 200 randomly chosen samples coloured by environment (EMPO level 2). Beta-diversity patterns between the two sequence lengths are similar.

