
Figure 1. The malonylation percentage of DTGs is highly uniform across treatments and developmental stages.
(A) Structures of 17-DTGs and their malonylation options. R1 could be glucose, rhamnose or hydrogen. R2 could be rhamnose or hydrogen. NaMaT indicates malonyltransferase in N. attenuata. (B) Relative abundance (mean + SE; n = 5 – 6) of different malonylated DTGs in N. attenuata leaves, after herbivory elicitation by immediately applying M. sexta oral secretions to freshly created leaf puncture wounds (W + OS), in comparison to the same nodal positions of plants without any treatment (Con). Inset: Total DTG abundance in control and W + OS elicited leaves. (C) Total DTGs in different stages of floral development. The formula (D) describes how malonylation percentage was calculated. (E, F) Malonylation percentage (mean + SE; n = 5 – 6) of DTGs in leaves treated by W + OS (D) or different developmental flower stages (E). Asterisks indicate significant differences between controls and treatments (*p<0.05; ***p<0.001; Student’s t-tests). Different letters indicate significant differences among floral developmental stages (p<0.05, one-way ANOVA followed by Tukey’s HSD post-hoc tests).
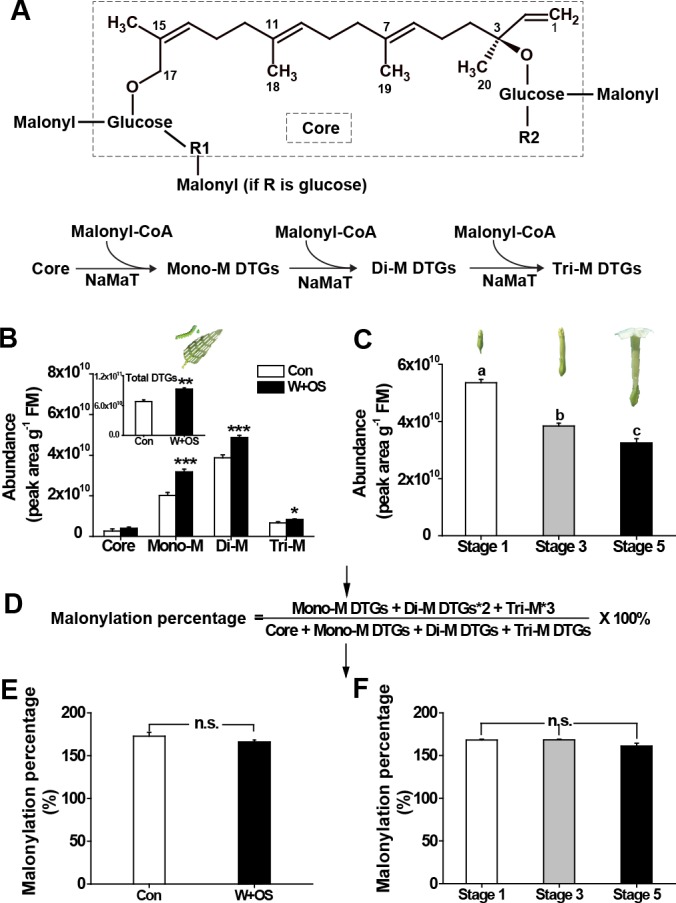
Figure 1—figure supplement 1. Structural diversity of N. attenuata DTGs, their diagnostic molecular ion [M + Na]+ and retention times.
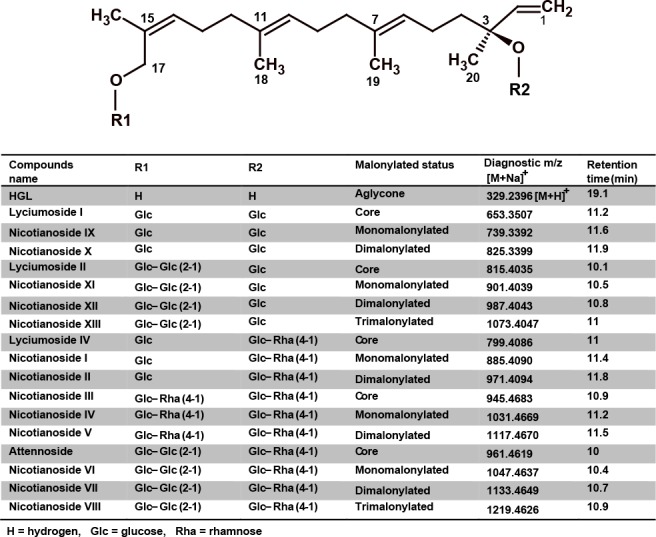
Figure 1—figure supplement 2. The DTG malonylation percentage is remarkably uniform across different tissues.
