Figure 4. Silencing NaMaT1 influences DTG profiles and malonylation percentages across all tissues, but alters JAs and IAA specifically in flowers.
S1 leaves from early elongated VIGS plants were treated with 20 µL lanolin paste (A, leaf control) or 150 µg MeJA in lanolin paste (B, leaf MeJA treated) and samples were harvested after 3 days. The inflorescence (C), style and stigma (D) were harvested from flowering plants. Relative abundance of different malonylated DTGs (first column) were analyzed from upper samples. Malonylation percentage (second column) was calculated based on the DTG data using the formula (Figure 1). Jasmonates (JAs, third column) and IAA (fourth column) were analyzed from the same samples as those used for DTG quantification. N.D. indicates compounds which were not detected because of low concentrations. Asterisks above each column indicate significant differences between EV and VIGS-MaT1 plants (*p<0.05; **p<0.01; ***p<0.001; Student’s t-test).

Figure 4—figure supplement 1. DTG profiles in VIGS plants having irGGPPS, irAOC, or EV backgrounds.

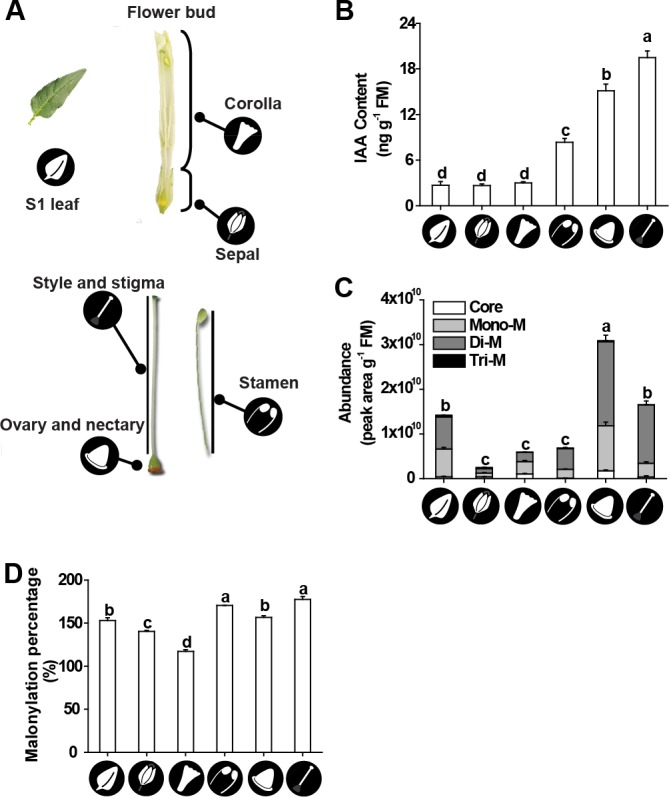
Figure 4—figure supplement 2. IAA and DTGs accumulate in high concentrations in the gynoecium.