. 2018 Oct 4;7:e38874. doi: 10.7554/eLife.38874

Figure 1. chit5 mutants are defective in nitrogen-fixing symbiosis.

(A) Three representative plants of wild-type Gifu and chit5 mutant alleles 6 weeks post-inoculation with M. loti R7A. Scale bar is 1 cm. (B) Gifu plants form pink nodules whilst chit5 mutants form mainly small white nodules, and occasionally pink-spotted (white arrows) nodules. Scale bars are 0.5 cm. (C) Average number of pink and white nodules formed by M. loti R7A over 4 weeks. (D) Nitrogenase activity measured as the amount of ethylene produced from acetylene in nodules of Gifu and chit5 mutants inoculated with M. loti R7A. (C) and (D) Error bars represent SEM and statistical comparisons of the number of pink nodules formed between genotypes at each time point are shown using ANOVA and Tukey post hoc testing with p values < 0.01 as indicated by different letters.

Figure 1—source data 1. Bacterial strains used in this study.
DOI: 10.7554/eLife.38874.007
Figure 1—source data 2. Primers used for RT-qPCR analyses.
DOI: 10.7554/eLife.38874.008

Figure 1.

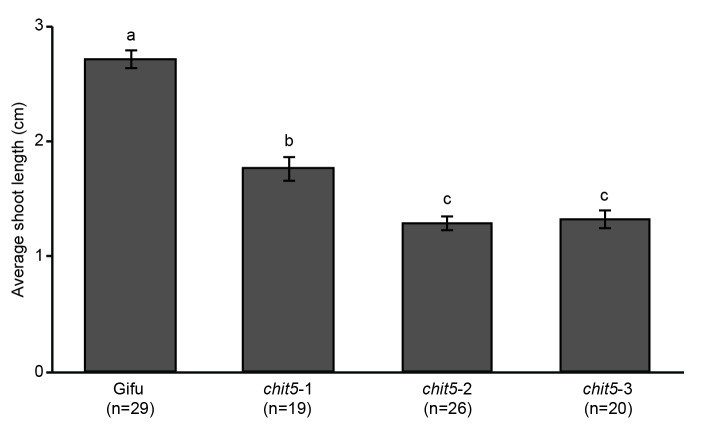
Figure 1—figure supplement 1. Shoot length of Gifu and chit5 mutants following inoculation with M.loti R7A.

Figure 1—figure supplement 1.

Average shoot lengths of the indicated genotypes were measured 4 weeks post-inoculation with M. loti R7A. Error bars represent SEM and statistical comparisons of shoot lengths between genotypes are shown using ANOVA and Tukey post hoc testing with p values < 0.01 as indicated by different letters.
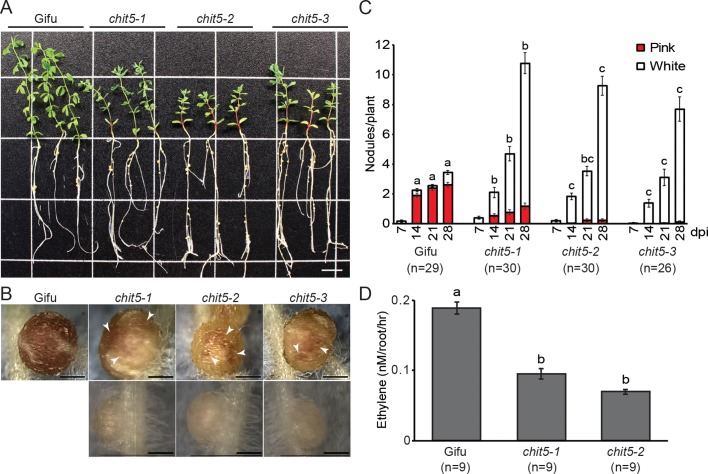
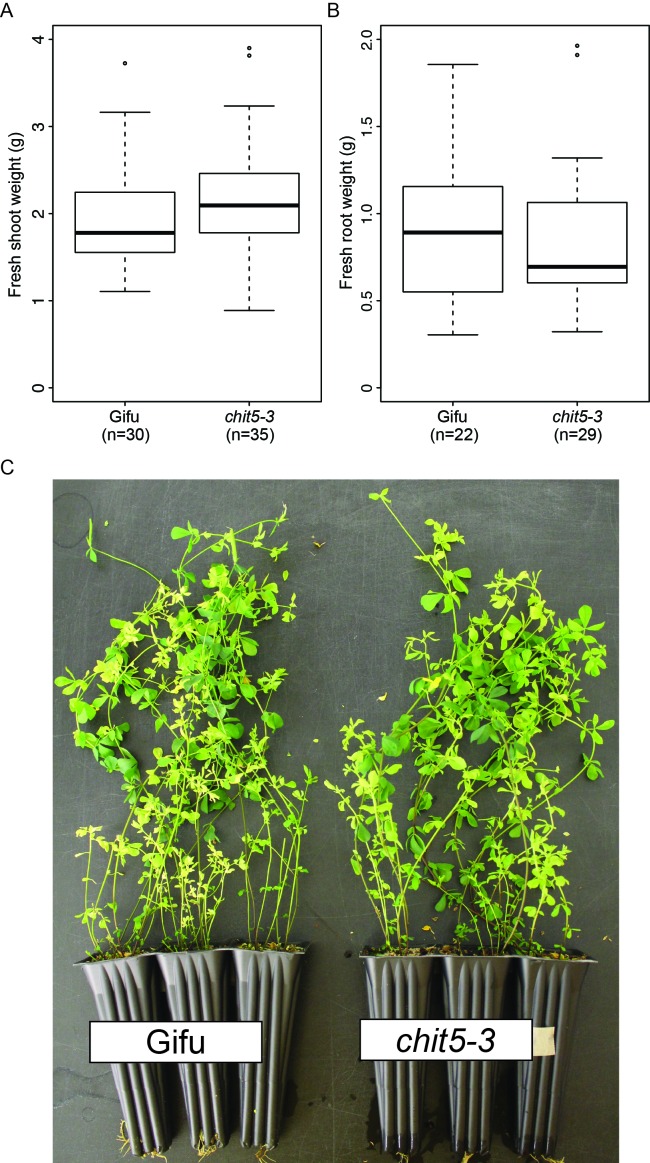
Figure 1—figure supplement 2. Wild-type and chit5-3 mutant show similar phenotype when grown in nitrogen-supplemented soil.

Figure 1—figure supplement 2.

Shoot weight (A) and root weight (B) of plants after 7 weeks growth in soil +10 mM KNO3. (C) Plant growth of representative plants as indicated. For (A) and (B) error bars represent SEM and statistical comparisons between the genotypes are shown using ANOVA and Tukey post hoc testing with p values < 0.01. No significant difference was detected between wild-type and chit5-3 plants.

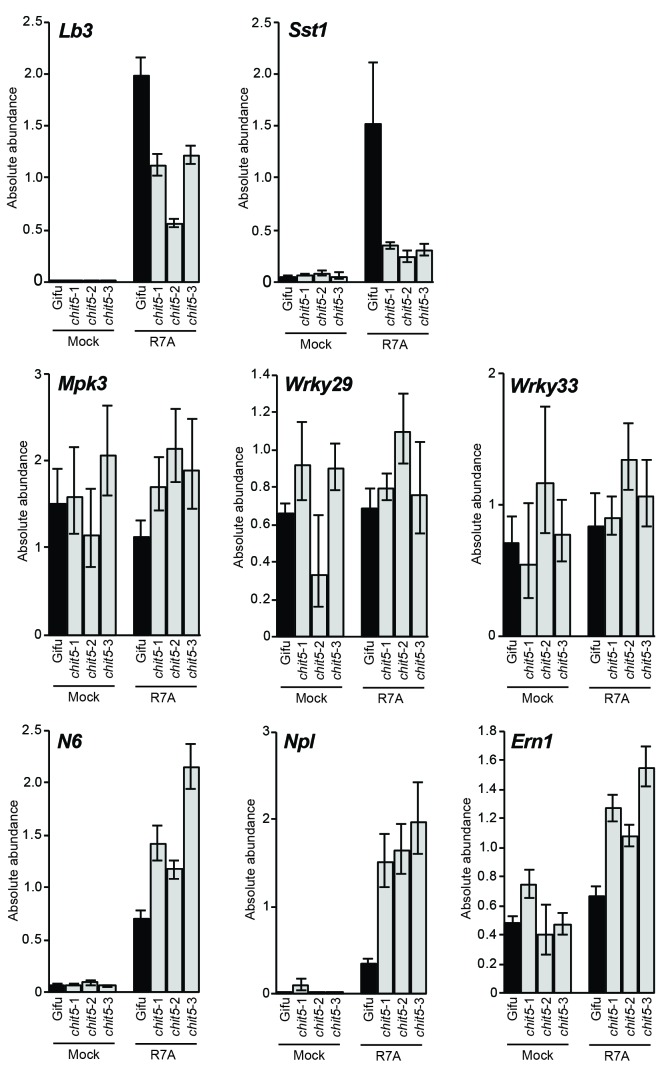
Figure 1—figure supplement 3. RT-qPCR analysis of symbiotic and defense gene expression in whole roots.

Figure 1—figure supplement 3.

Expression of the indicated symbiotic and defense genes was analysed in Gifu and chit5 mutant whole roots 21 dpi with M. loti R7A or mock-inoculation. Results are from biological and technical triplicates. Error bars represent SEM.

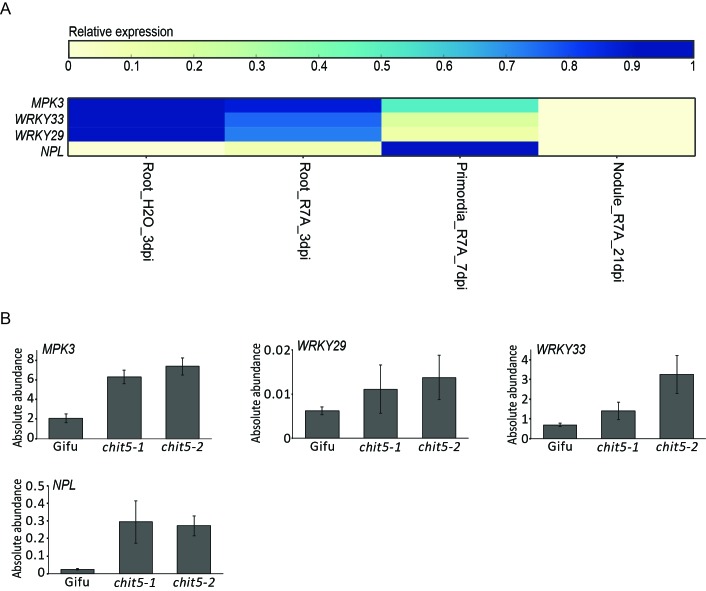
Figure 1—figure supplement 4. Expression of symbiotic and defense gene during symbiosis (A) and in wild-type and chit5 nodules (B).

Figure 1—figure supplement 4.

(A) Expression heatmap of the analysed genes as found in Kelly et al., 2018a. (B) Expression of the indicated symbiotic and defense genes was analysed by RT-qPCR in Gifu and chit5 mutant nodules at 21 dpi with M. loti R7A. Results are from biological and technical triplicates. Error bars represent SEM.