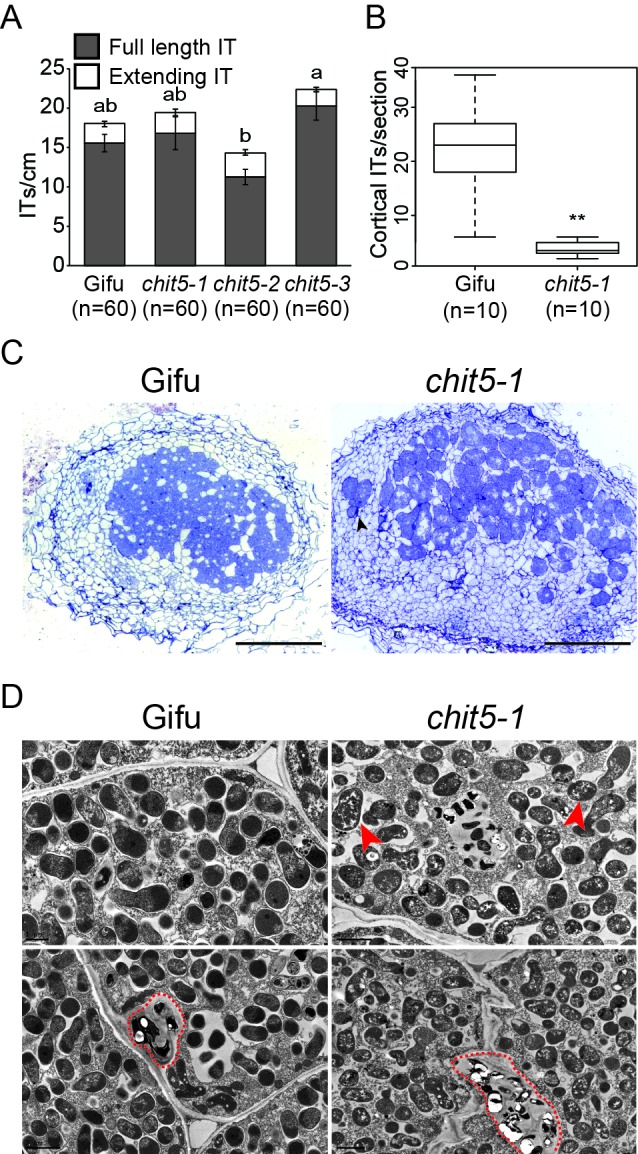
Figure 2. chit5 mutants have a defective nodule infection phenotype.
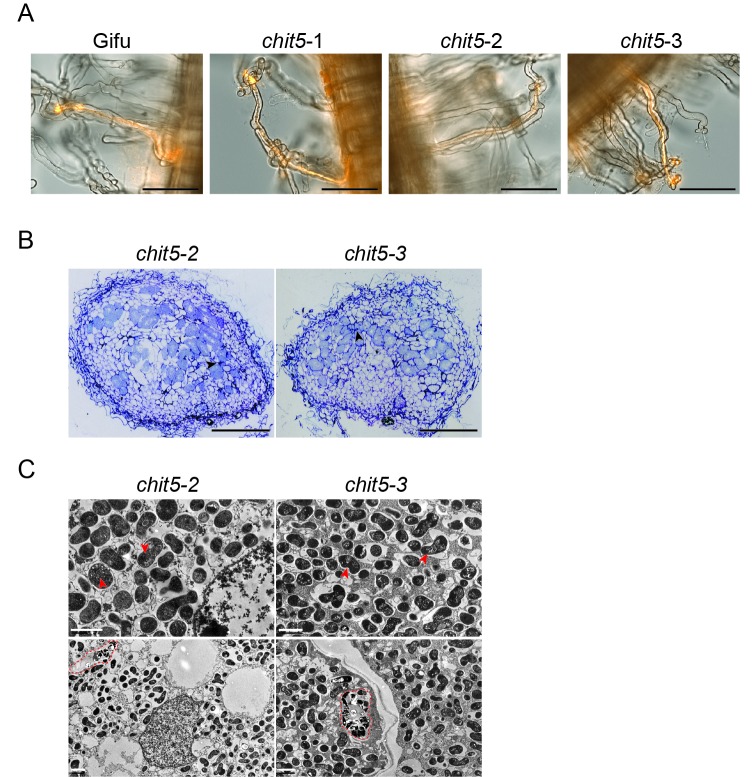
(A) Infection threads induced by M. loti + DsRed in Gifu and chit5 mutant root hair at 10 dpi . Error bars represent SEM and statistical comparisons of the number of full length infection threads formed between genotypes at each time point are shown using ANOVA and Tukey post hoc testing with p values < 0.01 as indicated by different letters. (B) Box plot of cortical infection thread counts performed on Gifu and chit5-1 nodule sections. t test p values are indicated by asterisks (**<0.01). (C) Light microscopy of nodule sections from the indicated plant genotypes 4 wpi stained with toluidine blue. Black arrows indicate bacteria between nodule cells. Scale bars are 200 µm (D) Transmission electron microscopy of nodule sections from the indicated plant genotypes 4 wpi. Red arrows point out bacteroids of stressed appearance with accumulated white spots, red dashed lines outline infection threads or invagination from the intercellular space. Note the difference between PHB bodies (large, white spots) characteristic for Mesorhizobium when present inside infection threads (red dashed outlines), and the small white spots present in the symbiosomes formed in the chit5 mutant nodules (red arrows). Scale bars are 2 µm. Corresponding images of chit5-2 and chit5-3 are in Figure 2—figure supplement 1.


