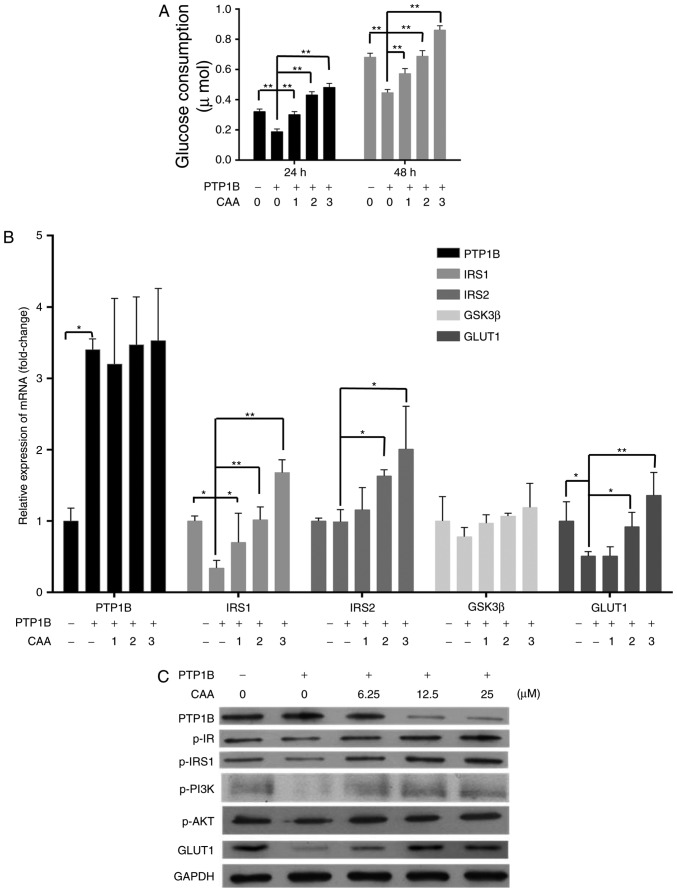
Figure 4.
CAA reverses the insulin resistance induced by overexpression of PTP1B in HepG2 cells. (A) Expression of insulin signaling genes as analyzed using reverse transcription-quantitative polymerase chain reaction analysis. (B) Expression and phosphorylation of insulin signaling proteins analyzed using western blot analysis with CAA (0, 6.25, 12.5 and 25 µM) and PTP1B intervention. All results are expressed as the mean ± standard error of the mean (n=3-6). (C) Glucose consumption in response to insulin with CAA. *P<0.05 and **P<0.01. 1, 2 and 3 indicate CAA concentrations of 6.25, 12.5 and 25 µM, respectively. PTP1B, protein-tyrosine phosphatase 1B; IRS, insulin receptor substrate; GSK3β, glycogen synthase kinase-3β; GLUT1, glucose transporter 1; PI3K, phosphoinositide 3-kinase; IR, insulin receptor; AKT, serine/threonine protein kinase; CAA, cajanonic acid A; p-, phosphorylated.

