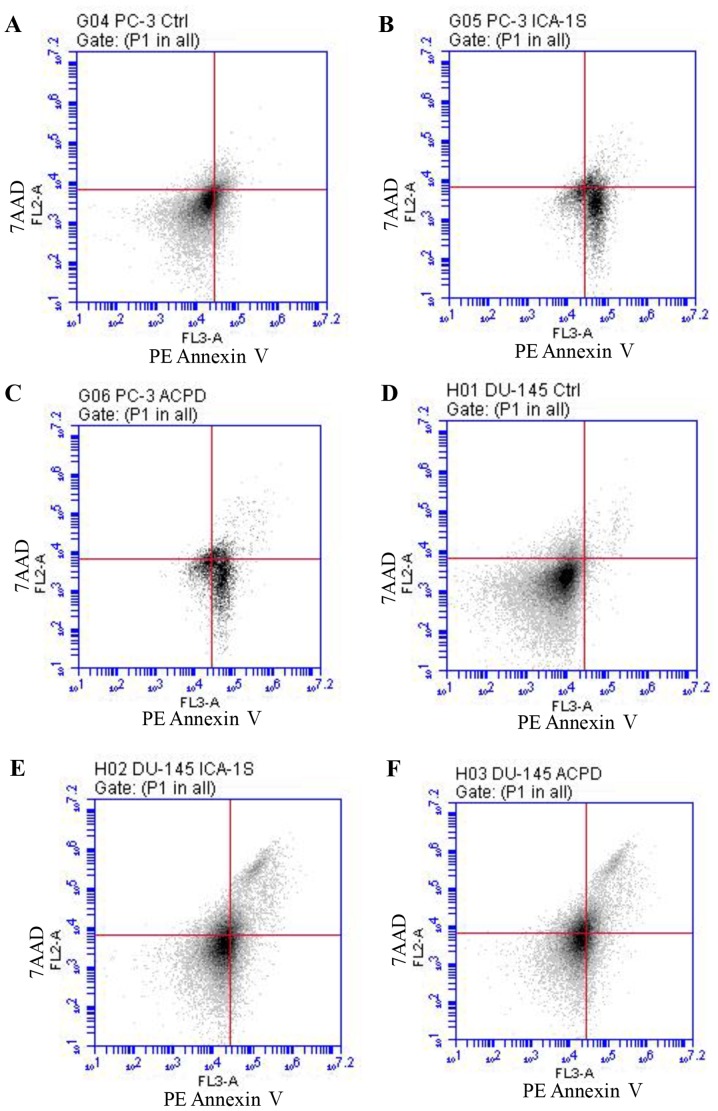
Figure 5.
Flow cytometric analysis of PE Annexin V staining for prostate cancer cells. Graphs show fluorescent emission of PC-3 cells in the (A) control, (B), ICA-1- and (C) ACPD-treated groups, and DU-145 cells in the (D) control, (E) ICA-1- and (F) ACPD-treated groups. Cells were incubated with PE Annexin V (x-axis) against 7AAD (y-axis). Cells were treated with ICA-1 and ACPD with respective IC50 concentrations for 24 h and 50,000 events were analyzed and recorded to obtain FL3-A (PE-Annexin V), vs. FL-2A (7-AAD). Three experiments were performed with 24 replicates and representative plots are shown. ACPD, polymerase; 2-acetyl-1,3-cyclopentanedione; ICA-1, 5-amino-1-(1R,2S,3S,4R)-2,3-dihydroxy-4-methylcyclopentyl)-1H-imidazole- 4-carboxamide; 7AAD, 7-amino-actinomycin; Ctrl, control.

