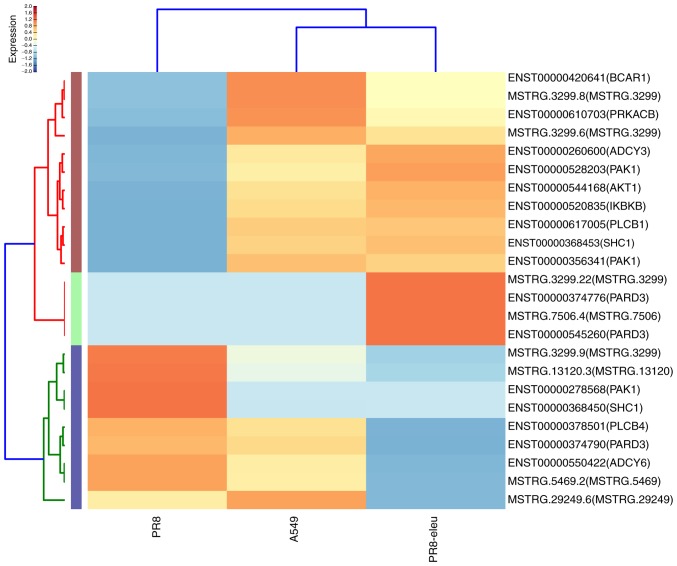
Figure 3.
Enrichment analysis results of DEGs regulated by eleutheroside B1 treatment in the chemokine signaling pathway. The heat-map shows the 24 DEGs that were regulated by eleutheroside B1 treatment among three samples in the chemokine signaling pathway (high levels of expression, red; low expression, blue). DEG, differentially expressed gene.

