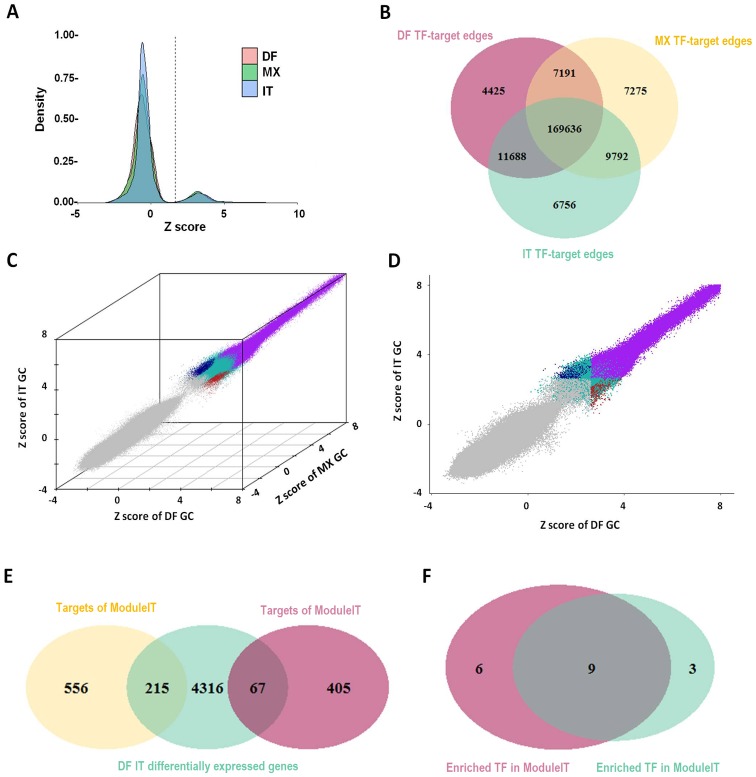
Figure 2.
Gene regulatory network construction, and DF- and IT-specific TF-target edge identification. (A) Edge Z-score distribution in different subgroups of GC. (B) Overlap of TF-target edges among the different subgroups of GC. (C) Identification of DF- and IT-specific TF-target edges in a 3D scatter plot, exhibiting Z scores of DF, MX and IT GC. Low confidence edges were colored gray, conserved edges were colored purple, DF-specific edges were colored red, IT-specific edges were colored blue and other edges were colored green. (D) Projection of 3D view through the y-axis. (E) Overlap of target genes in ModuleDF/ModuleIT and DF/IT differentially expressed genes. (F) Overlap of TFs enriched in DF-specific TF-target edges with DF differentially expressed genes (ModuleDF) and IT-specific TF-target edges with IT differentially expressed genes (ModuleIT). DF, diffuse; GC, gastric cancer; IT, intestinal; MX, mixed; TF, transcription factor.

