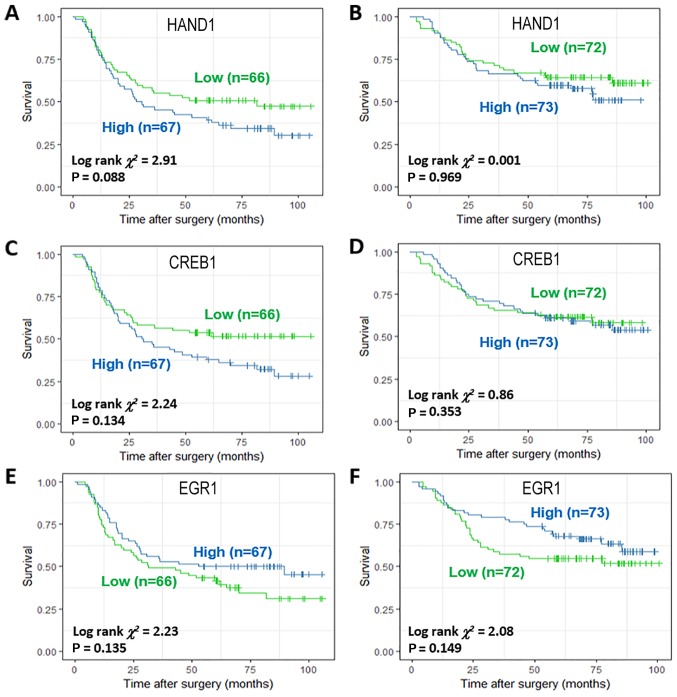
Figure 6.
Kaplan-Meier curves for HAND1 in (A) diffuse GC and (B) intestinal GC; Kaplan-Meier curves for CREB1 in (C) diffuse GC and (D) intestinal GC; Kaplan-Meier curves for EGR1 in (E) diffuse GC and (F) intestinal GC. The cutoff was based on the median value of each subgroup. CREB1, cAMP responsive element binding protein 1; EGR1, early growth response 1; GC, gastric cancer; HAND1, heart and neural crest derivatives expressed 1.

