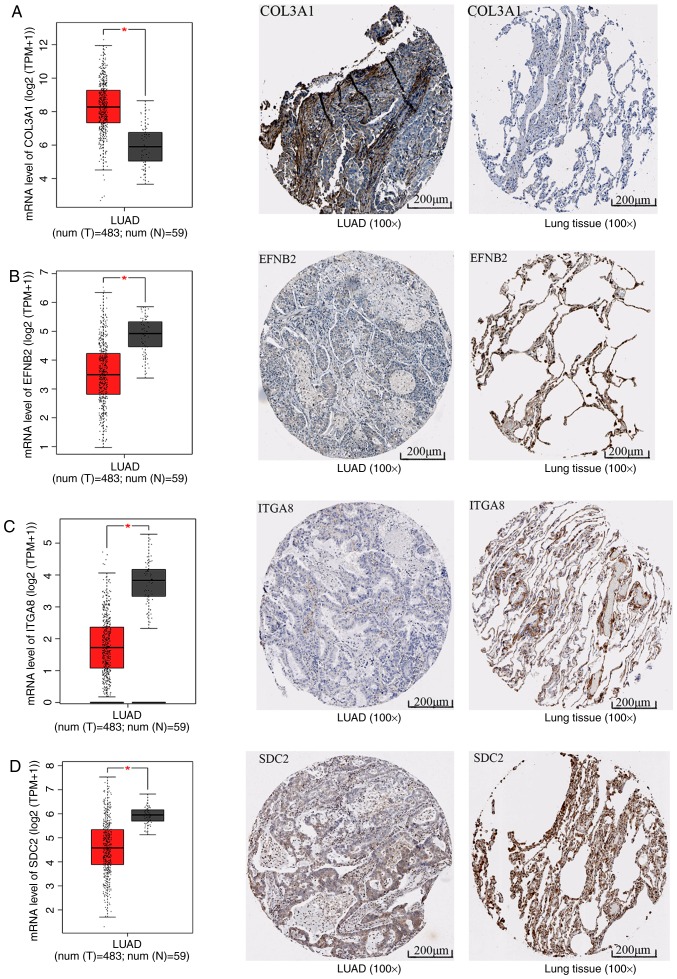
Figure 12.
mRNA and protein levels of molecules in the top three Kyoto Encyclopedia of Genes and Genomes pathways. The box plots represent the mRNA levels of the molecules; the red boxes represent the LUAD group and the gray boxes the normal controls. The five horizontal lines in the box plots from top to bottom represent the upper limit, upper quartile, median value, lower quartile and lower limit, respectively. Each black dot represents a tissue sample. In the immunohistochemical staining images, the left panel represents LUAD and the right panel represents the normal control. (A) COL3A1, (B) EFNB2, (C) ITGA8 and (D) SDC2. *P<0.05. LUAD, lung adenocarcinoma; COL3A1, collagen type III α1 chain; EFNB2, ephrin B2; ITGA8, integrin subunit α8; SDC, syndecan.

