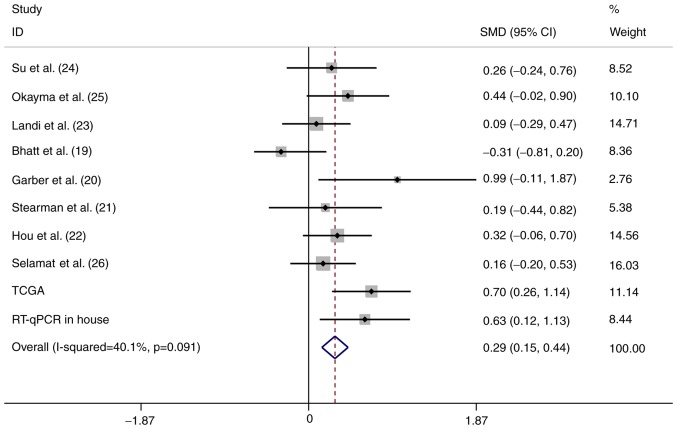
Figure 4.
Forest plot of the meta-analysis for HOXA11 expression in patients with lung adenocarcinoma within the 10 datasets included. The fixed-effects model was applied when combining the SMD. The grey squares represent the SMD value of each dataset; the different size of the squares reflect the weight of each study in the meta-analysis. The horizontal lines indicate the 95% confidence intervals of each study. The diamond represents the effect size (pooled SMD). SMD, standardized mean difference; CI, confidence interval; PCR, polymerase chain reaction; TCGA, The Cancer Genome Atlas; HOX, homeobox.

