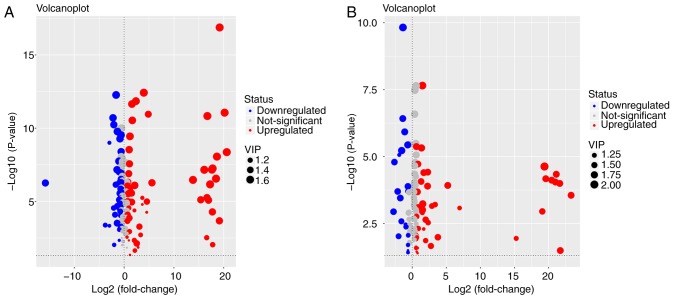
Figure 4.
Volcano plot of metabolites in the serum and liver tissue of the (A) cholestasis model (α-naphthyl isothiocyanate-treated) vs. the control group, and (B) melatonin treatment vs. model group. The y-axis shows the-log10 (P-value), while the x-axis presents log2 (fold change). Red, blue and grey circles represent the upregulated, downregulated and non-significant changes, respectively, while the size of the circles reflects the VIP value. VIP, variable influence on projection.

