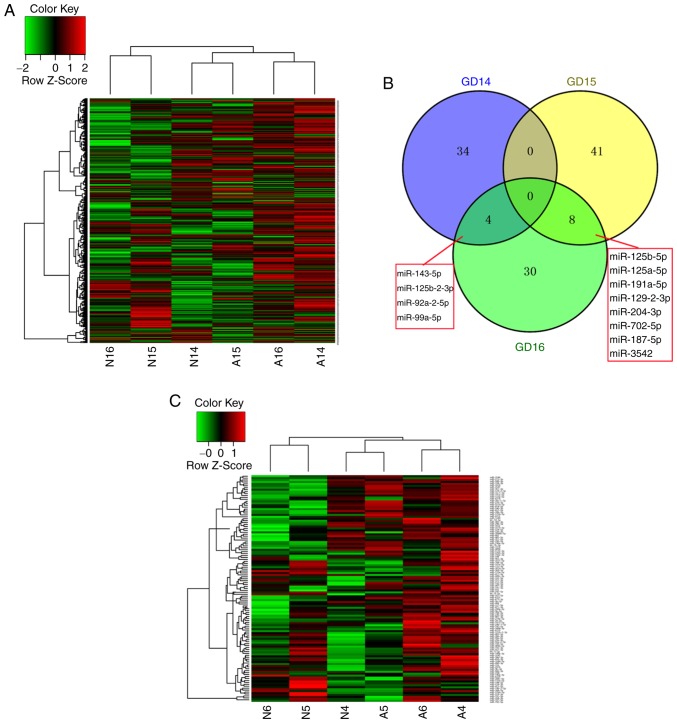
Figure 1.
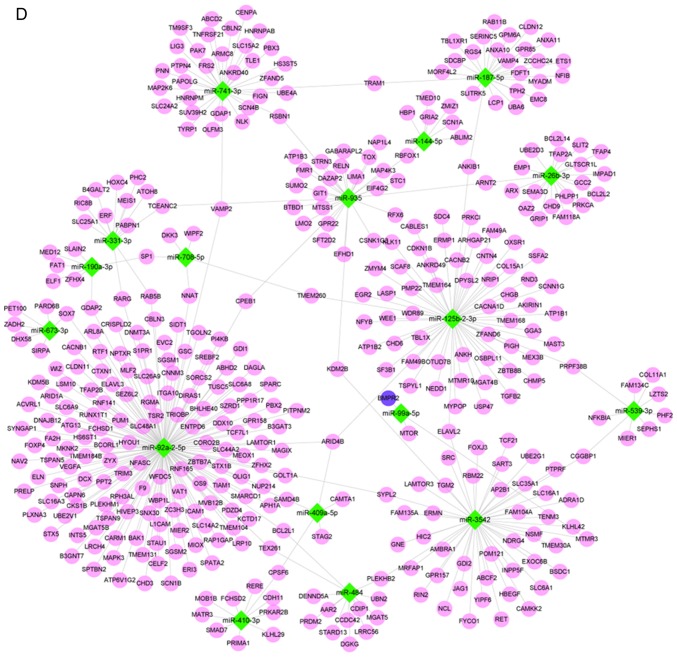
miRNA expression and miRNA-target gene regulatory network. In the heatmap, green and red indicate a decrease and increase of miRNA expression, respectively. The intensity of the color corresponds to the relative signal level on a logarithmic scale. (A) Hierarchical heatmap of the overall microarray screening. (B) Venn diagram of differentially expressed miRNAs at three time-points. (C) Hierarchical heatmap of differentially expressed miRNAs.


