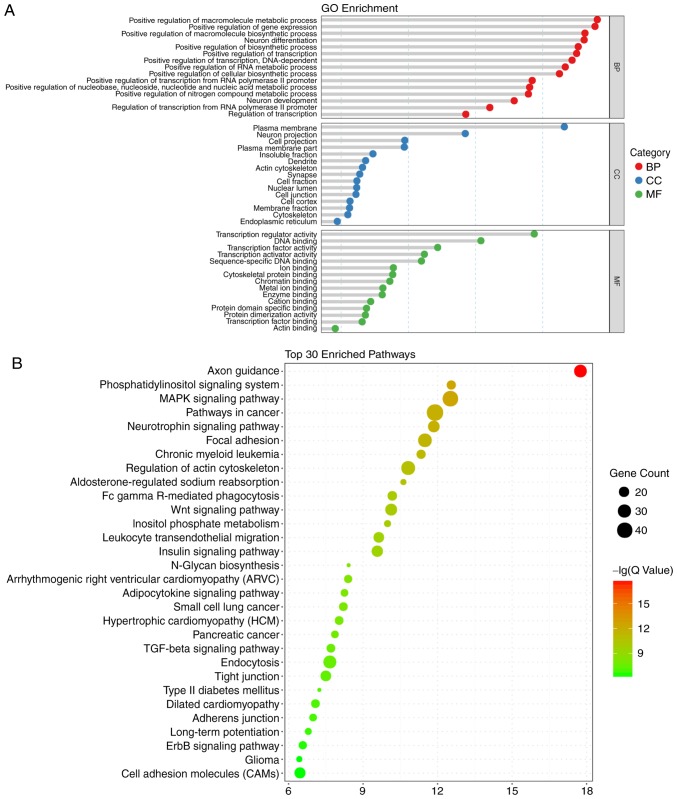
Figure 2.
GO and KEGG enrichment analyses ranked by enriched factor, which was calculated by -log(q-value). The q-value is a modified Fisher exact P-value provided by Database for Annotation, Visualization and Integrated Discovery enrichment analysis. (A) GO enrichment results; the top 15 GO categories are listed in the diagram. (B) Top 30 enriched signaling pathways from KEGG analysis. GO, Gene Ontology; KEGG, Kyoto Encyclopedia of Genes and Genomes; BP, biological process; CC, cellular component; MF, molecular function.

