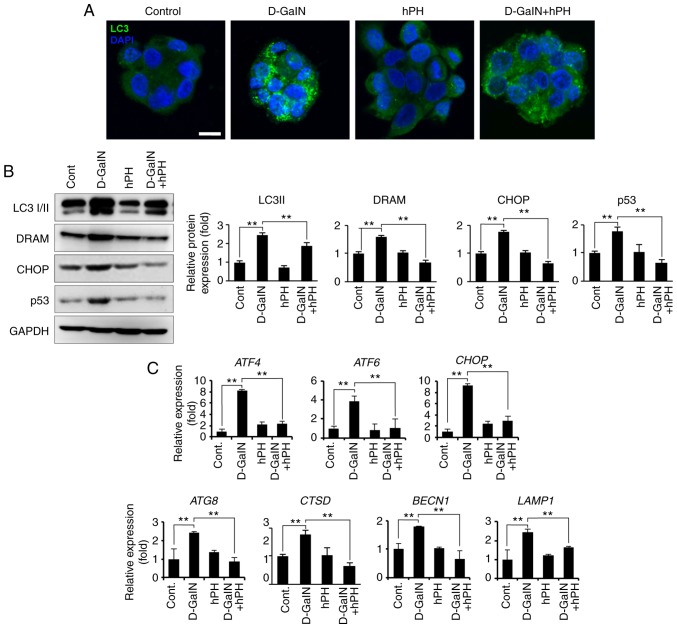
Figure 6.
hPH treatment results in altered autophagy regulation in HepG2 cells following D-GalN stimulation. (A) HepG2 cells treated with hPH exhibit minimized autophagy flux. To detect autophagosomes, cells were immunostained with anti-LC3 antibody. Nuclei were identified using DAPI staining (scale bar=10 µm). (B) Cell lysates were immunoblotted with anti-LC3 I/II, anti-DRAM, anti-CHOP, anti-p53, or anti-GAPDH antibodies. Representative western blot images (left panel) and densitometry results (right panel). All data are presented as the mean ± standard error of the mean. **P<0.01, vs. D-GalN group. (C) Transcript levels of ER stress- and autophagy-related genes were determined by reverse transcription-quantitative polymerase chain reaction analysis. All data are presented as the mean ± standard error of the mean. **P<0.01, vs. D-GalN group. hPH, human placental hydrolysate; D-GalN, D-galactosamine; Cont, control; LC3, microtubule-associated protein 1A/1B-light chain 3; DRAM, damage-regulated autophagy modulator; CHOP, C/EBP homologous protein; ATF, activating transcription factor; BECN1; beclin 1; LAMP1, lysosomal-associated membrane protein 1.

