Figure 3.
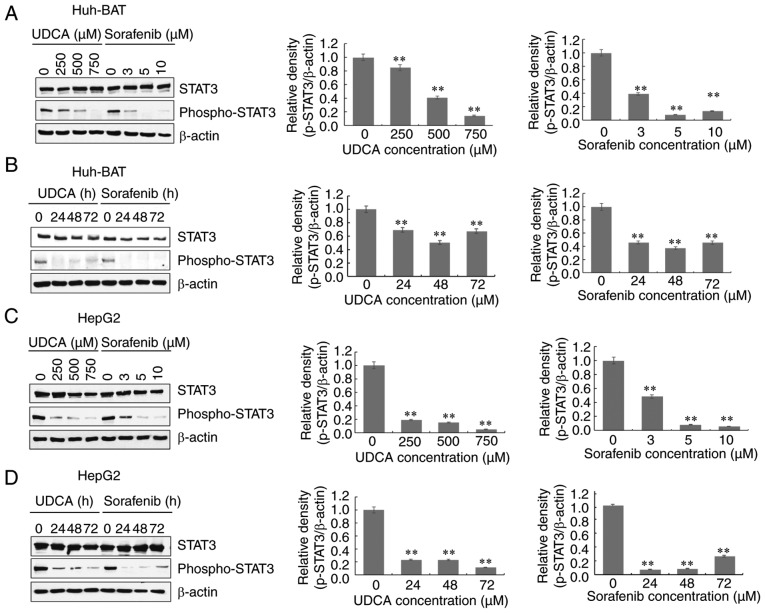
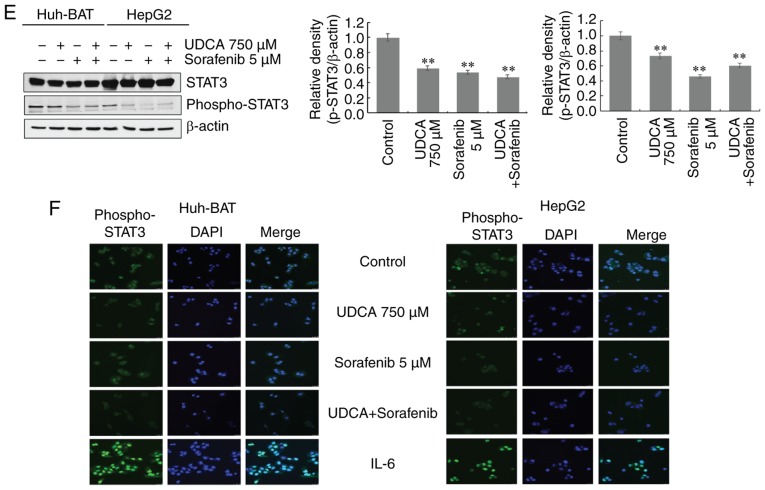
Sorafenib and UDCA suppress activation of STAT3 in a time- and concentration-dependent manner. (A) Huh-BAT cells were treated with various doses of UDCA or sorafenib for 48 h. (B) Huh-BAT cells were treated with 750 μM UDCA or 5 μM sorafenib for various timepoints. (C) HepG2 cells were treated with various doses of UDCA or sorafenib for 48 h. (D) HepG2 cells were treated with 750 μM UDCA or 5 μM sorafenib for various timepoints. (E) Cells were treated with 5 μM sorafenib, 750 μM UDCA or both for 48 h. Protein expression levels of STAT3 and phospho-STAT3 were evaluated by western blotting. β-actin was used as a loading control. Representative blots and quantifications are shown for all panels. Data are presented as means ± standard deviation. **P<0.01 compared with control untreated cells. (F) Huh-BAT and HepG2 cells were treated with 5 μM sorafenib, 750 μM UDCA, or both for 48 h. Treatment with 50 ng/ml IL-6 for 30 min was used as a positive control for STAT3 activation. Following treatments, localization of phospho-STAT3 was evaluated using immunofluorescence. Magnification, ×400. UDCA, ursodeoxycholic acid; STAT3, signal transducer and activator of transcription 3; IL-6, interkleukin-6.


