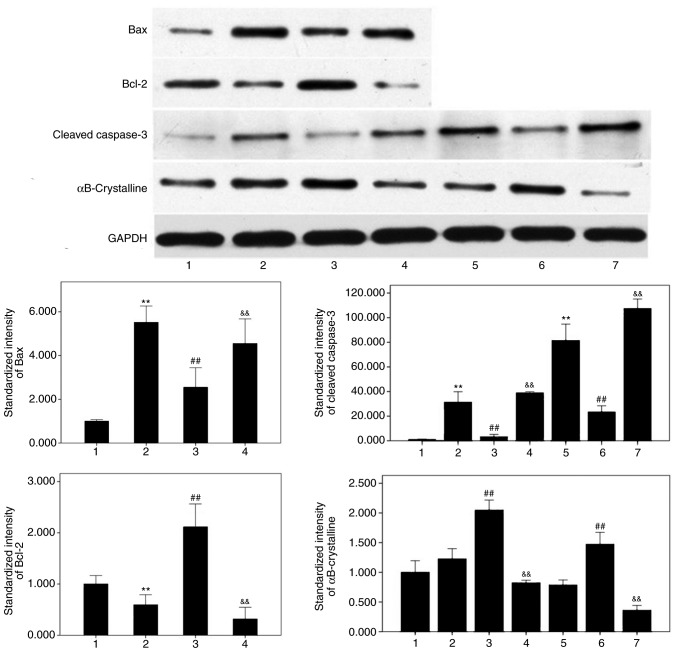
Figure 7.
Western blot assay demonstrated the variations in Bax, Bcl-2, cleaved-caspase-3 and αB-crystallin expression levels. [Groups: 1=control, 2=(3 h) t-BH, 3=(3 h) t-BH+DHA, 4=(3 h) t-BH+DHA+fluoxetine, 5=(6 h) t-BH, 6=(6 h) t-BH+DHA, 7=(6 h) t-BH+DHA+fluoxetine]. Following treatment with 300 μmol/l, the levels of these factors were in accordance with the results of immunofluorescence assay. Data are presented as the mean ± standard error (n=3), with experiments performed in triplicate. **P<0.01 vs. control group; ##P<0.01 vs. t-BH group; &&P<0.01 vs. t-BH+DHA group.

