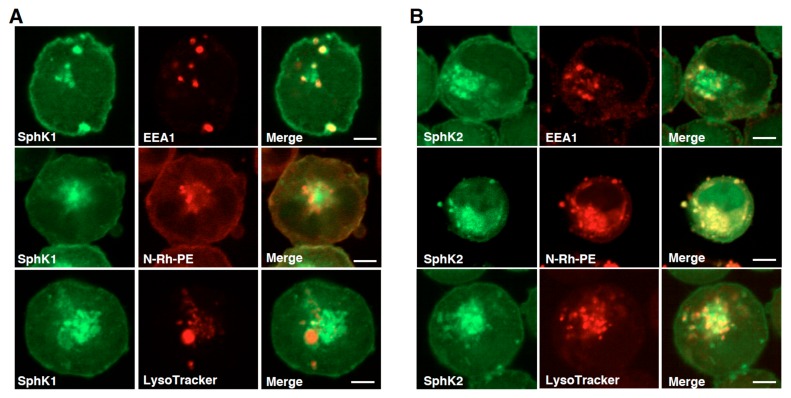
Figure 1. Cellular distribution of Sphk1 and SphK2 in K562 cells.
K562 cells stably expressing either SphK1-GFP (A) or SphK2-GFP (B) were prelabeled with N-Rh-PE or LysoTracker, then fixed and analyzed for each fluorescence localization by confocal microscopy. In some experiments cells stably expressing these fluoro-proteins were fixed, permeabilized and stained with anti-EEA1 antibody and analyzed as above. Scale bars, 5 μm.

